🕐 BTC/USDT Technical Outlook — Next 4–6 Hours
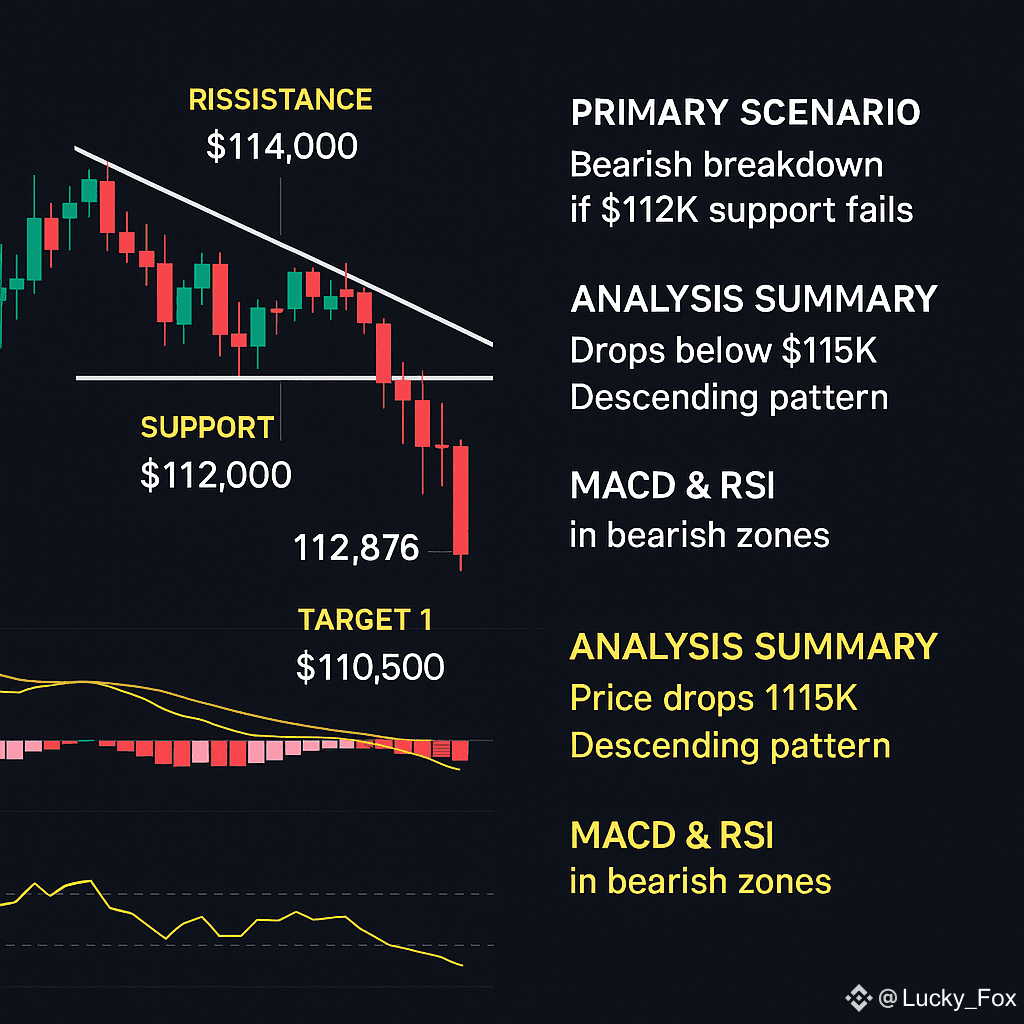
Bitcoin has slipped to $112,876, breaking below the critical $115K support level and retesting multi-week lows (~$112,831). The move followed U.S. tariff-related market risk and weak investor sentiment.
📉 Chart Structure & Pattern
BTC appears to be exiting a consolidation pattern and entering a descending continuation setup, which suggests momentum may favor downside movement.
⚙️ Key Indicators
RSI (~50 4H) shows neutral momentum — no oversold/overbought extremes yet.
MACD & Volume point toward fading bullish energy and increased selling pressure.
Momentum theme: liquidation by short-term holders at a loss (~21,400 BTC in last 24h) suggests capitulation and heightened volatility.
🎯 Trade Scenarios
🔻 Bearish Breakdown (Primary Outlook)
Trigger: Price fails to reclaim $114K and breaks below $112K support strongly
Targets:
1. $110,500 (initial)
2. $109,000–$108,500 (secondary)
Stop-loss: ~$113,200–113,300
🟢 Bullish Reversal (Alternative)
Trigger: Clean bounce above $114K with volume confirmation
Targets:
1. $115,500
2. $116,800–$117,000 (retest zone)
Stop-loss: ~$112,700
📊 Summary Table
🧠 Strategy Notes & Risk Outlook
📌 Volume is key: watch for confirmation of any breakout or breakdown with a spike in volume.
⚠️ Breaking below $112,000 significantly increases probability of deeper stress toward $110K.
✅ Holding above $114K may signal short squeeze or contrarian bounce, but risk remains until structure flips.
🧭 Summary
BTC has shifted into a bearish momentum phase after breaching key supports. While a bounce is possible, bearish continuation toward $110K remains the higher-probability scenario unless BTC reclaims $114K quickly with strength. Trade carefully and verify signals before entering positions.
#BTC #BinanceSquare #CryptoAnalysis
🔔 Disclaimer: This is for educational purposes only and not financial advice. Always do your own research (DYOR), use proper risk management, and adjust entry levels to your trading style.