🟡 BNB — $756.74 | -1.64% | Cap: $105.53B
📊 Current technical analysis:
BNB is holding up better than other assets, with a controlled drop of -1.64%. It is currently supported by its key horizontal support at $750, an area where it has bounced back three times previously.
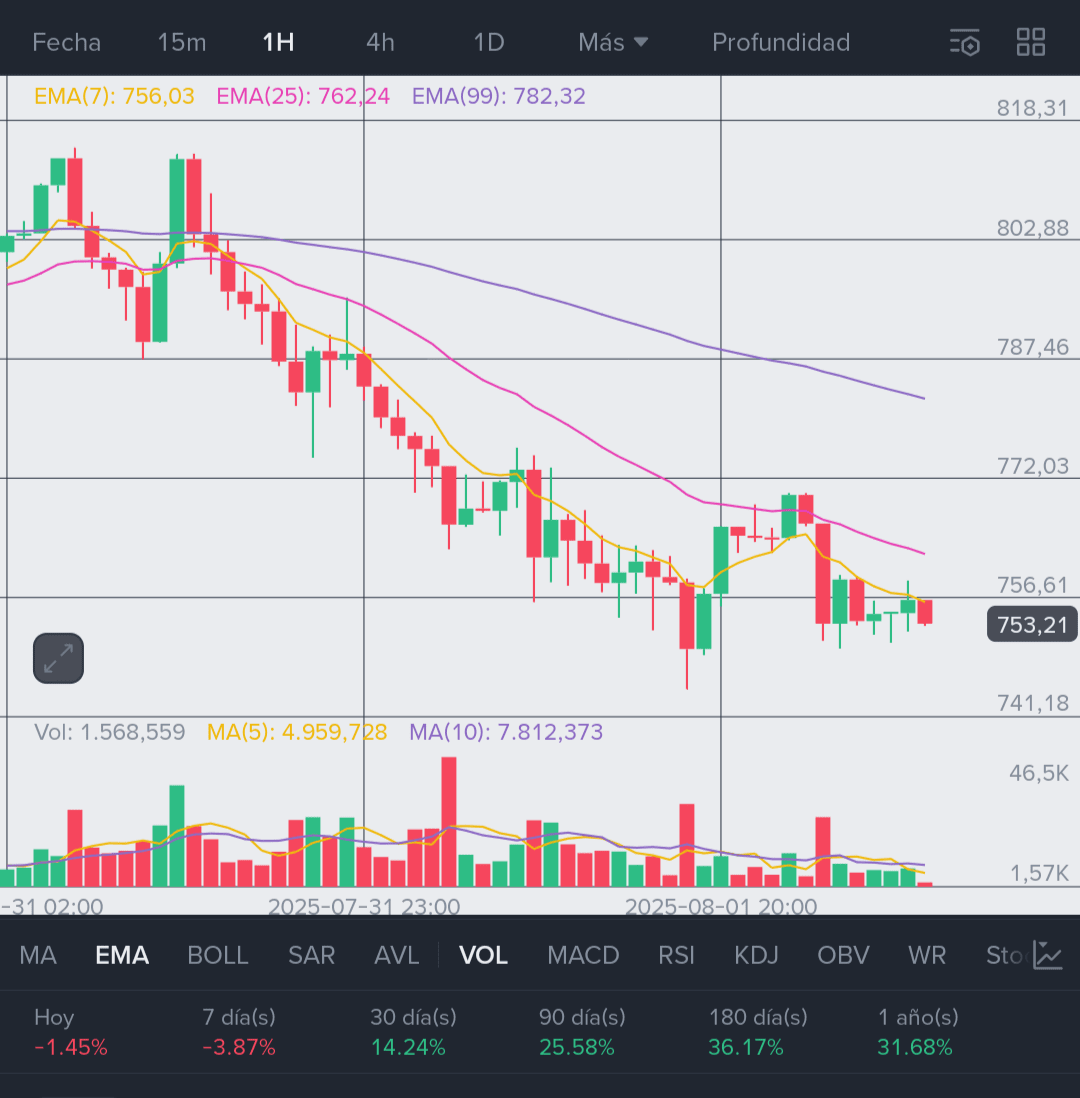
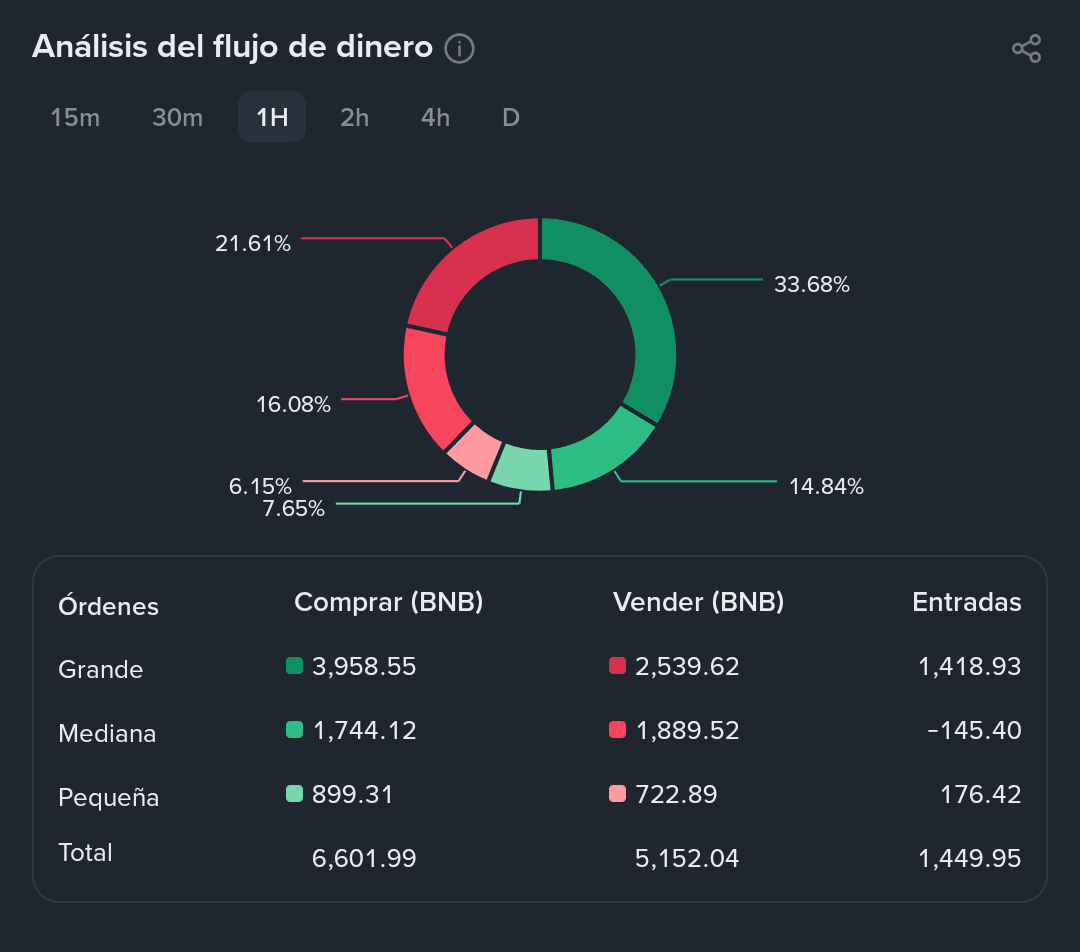
The 200-period moving average continues to act as dynamic support, while the RSI at 49 and the MACD's neutral crossover suggest a pause rather than a bearish reversal. Binance, as an ecosystem, continues to show user growth, and activity on BNB Chain remains strong.
📈 Technical resistance: $770
📉 Key support: $740
📊 Bollinger Bands: Price approaching the lower band, possible bounce.
📌 Projection:
BNB could move sideways between $740 and $770 in the coming days. If it breaks $770, the next target is $800.
🧭 Strategic Reflection:
The current movement is more of a rest before a possible bullish continuation.
