For newcomers to the cryptocurrency market, mastering some practical trading skills is crucial. Below are the insights shared by a cryptocurrency trader worth over a hundred million.
1. Select strong cryptocurrencies, guided by the 60-day moving average.
When trading cryptocurrencies, focus on those with strong performance. If you are unsure, you might want to observe the 60-day moving average (i.e., the 60-day MA). When the price is above the 60-day moving average, it is a good time to consider buying or adding to your position; once the price drops below the 60-day moving average, you should decisively exit. This tactic is very effective in most cases.
2. Enter at low positions to avoid chasing highs
When encountering cryptocurrencies that rise more than 50% overnight, do not rush to chase the high, as this can easily lead to panic. Instead, you should choose to enter at a low position, which carries relatively less risk and potentially greater returns.
3. Capture signals before a big rise.
Before a significant price increase, there are usually some signals. For example, the price may fluctuate within a relatively narrow range, with a variation of about 10% to 20%, while trading volume significantly decreases. At this time, you can slowly buy in at low positions, and most likely catch the upcoming rise.
4. Keep up with new market hotspots
Whenever new hotspots appear in the market, the first few days are often very hot. This is a good time to seize profit opportunities. You can follow the flow of large funds to easily achieve profits.
5. Stay calm during bear markets.
Once entering a bear market, control your hands and do not make impulsive moves for at least six months. During unfavorable market conditions, reduce operations and learn to rest. True experts know how to rest at the right time.
6. Review regularly and adjust strategies.
You should review your trading records weekly, but the focus should not be on how much money you made, but whether your trading strategy was correct. If the strategy is correct, stick with it; if the strategy is wrong, adjust in time. After a few months, your cryptocurrency trading journey will become increasingly stable.
Often, interpreting chart patterns can open doors to profitability for traders. Today we will delve into the 'triple top chart pattern,' which is highly regarded by traders for its predictive ability and the insight it provides into the psychology of buyers and sellers.
Why do I say this? Because compared to other trend reversal patterns, the triple top pattern is stronger and more reliable. The price has failed to break through the key level three times in a row, which means there is a stronger resistance or support.
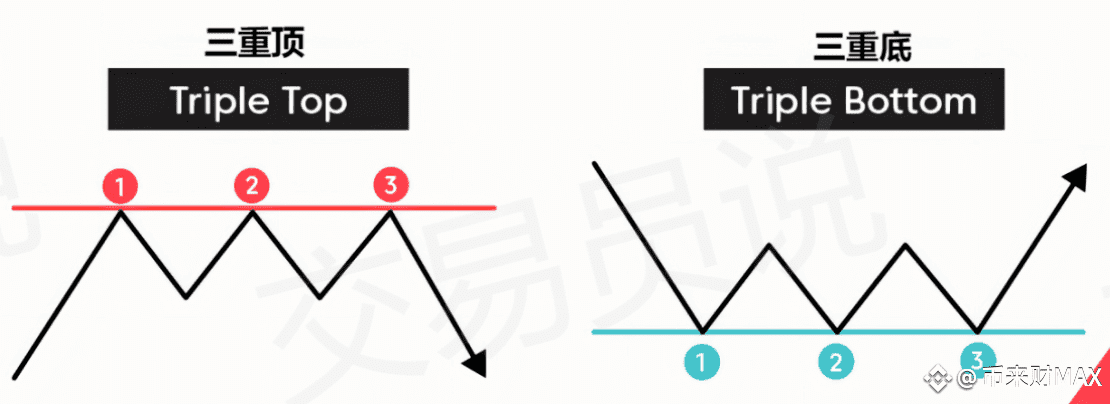
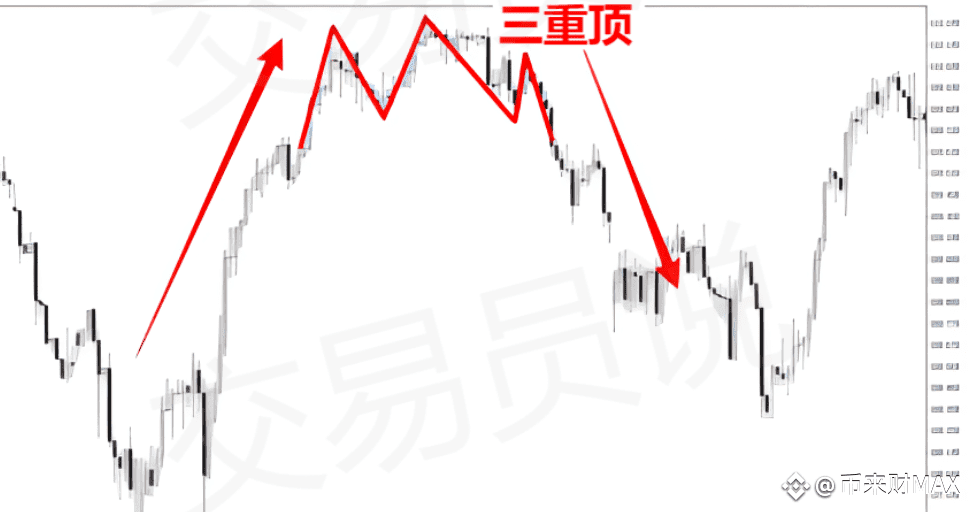
On the chart, the triple top pattern consists of three 'peaks' that almost reach the same price level, indicating that the price may no longer be in an uptrend, suggesting that the price may face a downward reversal. The triple top can appear in all timeframes, but it must follow an uptrend to consider this pattern. This chart reversal pattern looks like the letter 'M' on candlestick charts.
In contrast to the triple top, the triple bottom chart pattern looks like the letter 'W', and this pattern will appear after a downtrend, with the three bottoms touching the same price level before breaking through the resistance.
However, it is worth noting that while triple tops and triple bottoms are very reliable, their frequency of formation is not high and can be difficult to maintain.
What is the triple top chart pattern trading strategy?
It is well known that the triple top chart pattern trading strategy is a reversal strategy designed to capitalize on a simple yet very powerful chart pattern. One of the main advantages of reversal trading strategies is that they give you the opportunity to participate in new trends from the very beginning.
As mentioned above, the triple top pattern may actually take a long time to form, but it reflects the fierce struggle between buyers and sellers.
However, within the intraday trading timeframe, triple top reversals may occur more frequently, which is why we prefer to day trade using the triple top chart pattern strategy.
What is the triple top pattern?
According to traditional definitions, the triple top pattern is one of many reversal patterns, intuitively demonstrating the transfer of trend control.
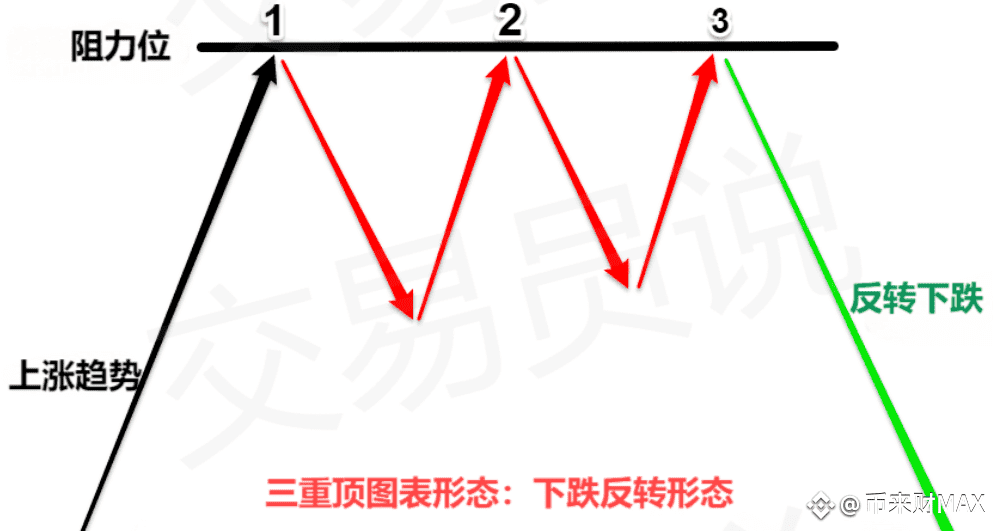
A perfect triple top reversal structure consists of three almost or completely identical price-level highs, where the market fails to break this price level. Furthermore, the reaction from the resistance level for the third time indicates that seller interest exceeds buyer interest, and the trend is reversing.
We need to define several rules for the triple top pattern:
◎ Rule 1: To achieve a reversal, there must be a prior trend to reverse against. In the case of a triple top reversal, we need to look for a bullish trend that ultimately enters the region of fluctuating highs, where there is enough selling pressure to halt the further development of the uptrend.
◎ Rule 2: The strength of the uptrend may determine the intensity of subsequent sell-offs.
Now, let's delve into the psychological factors behind the triple top reversal.
The psychological mechanism behind the triple top pattern.
The psychology behind the triple top reversal indicates that the buying momentum is gradually feeling exhausted, or they do not have enough strength to push the price higher.
At the same time, sellers become more aggressive as they are ready to trade at higher prices. Ultimately, we reach the balance point of buying and selling power.
The triple top pattern is a more powerful reversal pattern because it fails to break through the resistance level for the third time. More sellers notice the weakness of buyers who cannot push the price higher, so they become more aggressive in intervening, ultimately successfully driving the price down.
Note: Mass psychology indicates that failing to break through the resistance level three times enhances the importance of that level.
Now, let's see how to effectively use the triple top chart pattern trading strategy and profit from it.
How to use the triple top pattern trading strategy.
The triple top pattern rarely appears in higher timeframes, which is why we primarily apply the triple top chart trading strategy on intraday charts. Of course, you can safely use this strategy in higher timeframes, but it requires a lot of patience due to the fewer signals.
Step #1: The triple top reversal is composed of three rounded tops.
You need to identify three rounded tops to consider the triple top pattern as tradable. But what is a rounded top?
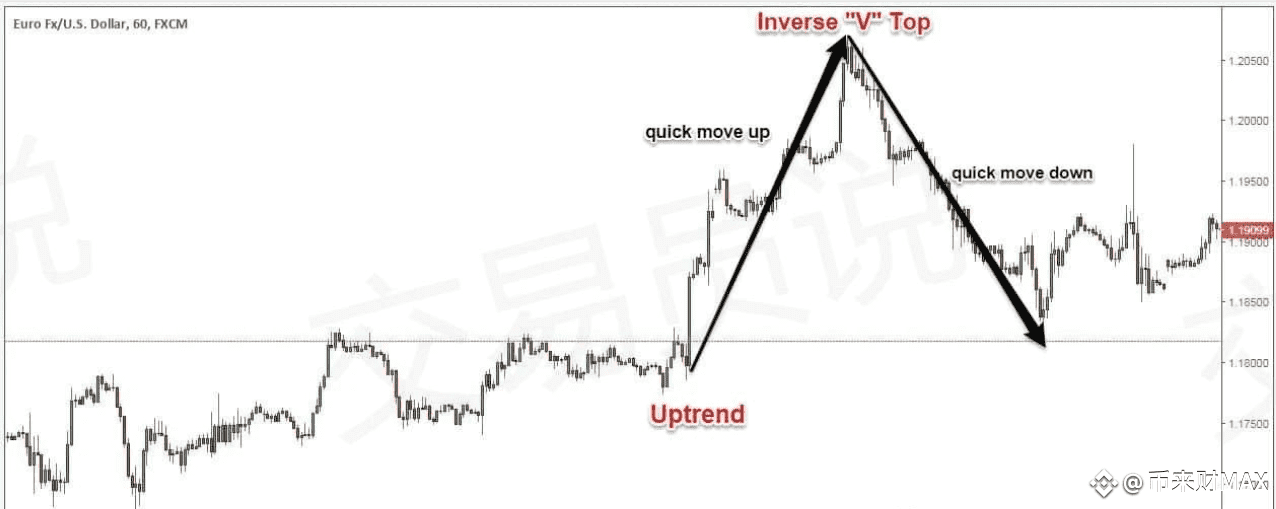
In technical analysis, rounded tops usually occur after an uptrend; the price moves up first and then quickly retreats, forming a dome, sometimes appearing as an inverted 'V'.
According to the structure of the triple top reversal, the size and amplitude of the inverted V top may vary. Regardless, the key is that we need to see the price rise rapidly and then fall quickly to define a rounded top.
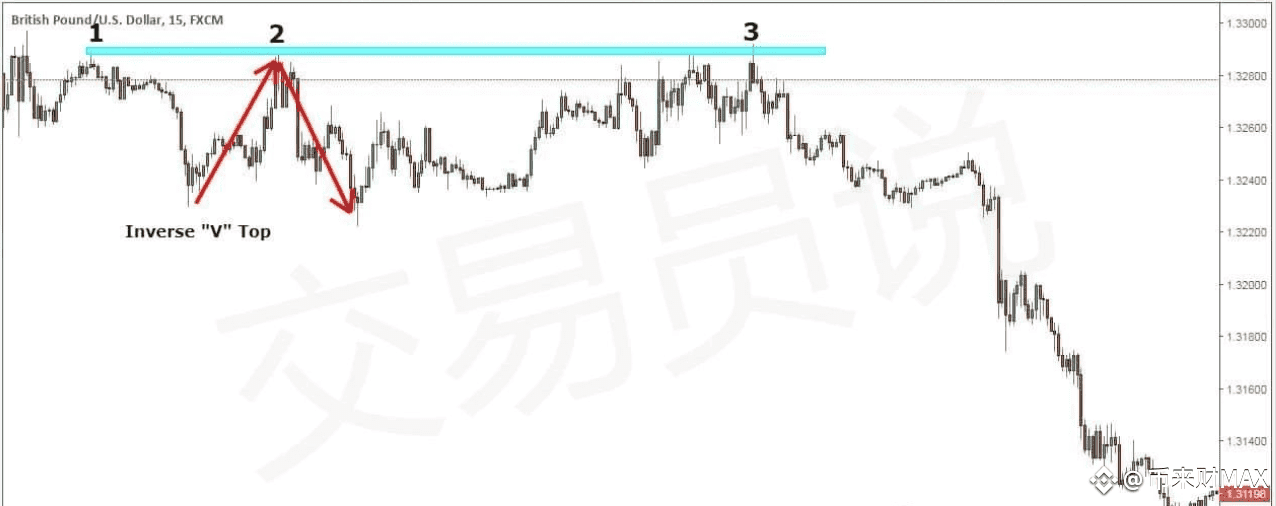
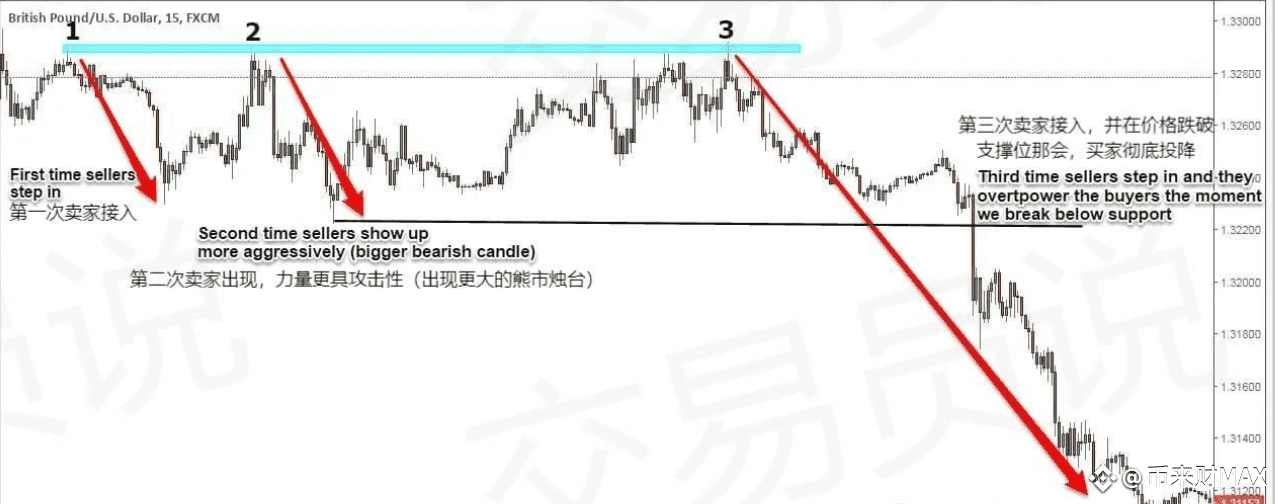
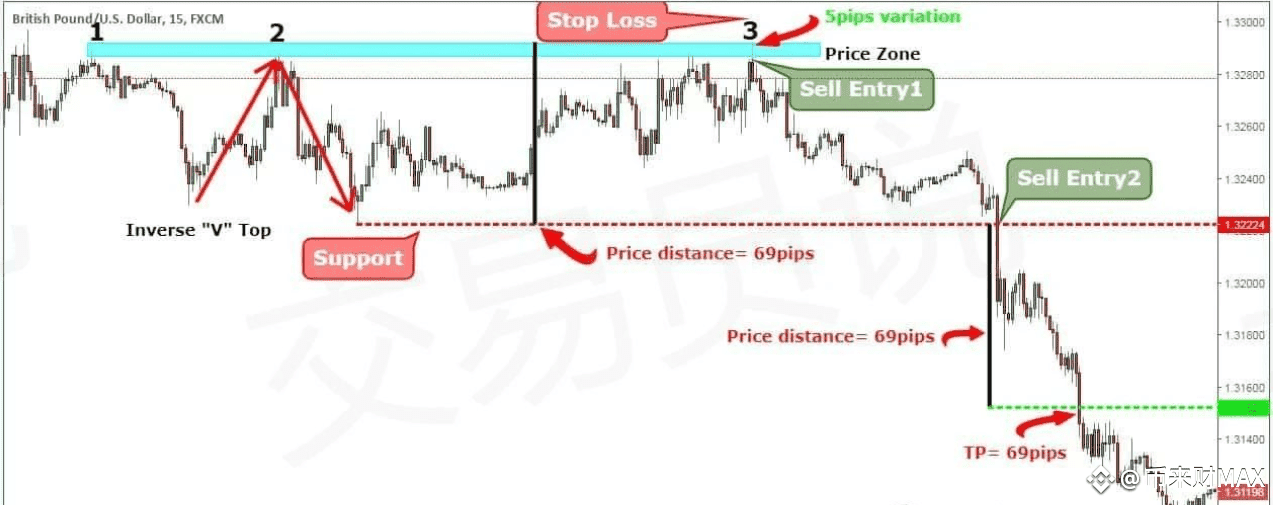
To practice the triple top chart trading strategy, we chose the GBP/USD triple top reversal shown in the image above. It can be noted that in all three tops, the inverted 'V' top appears to some extent.
Note: Do not strive for perfection, as in trading, you need to rid yourself of an idealistic mindset; inverted 'V' tops do not always look perfect, so be flexible.
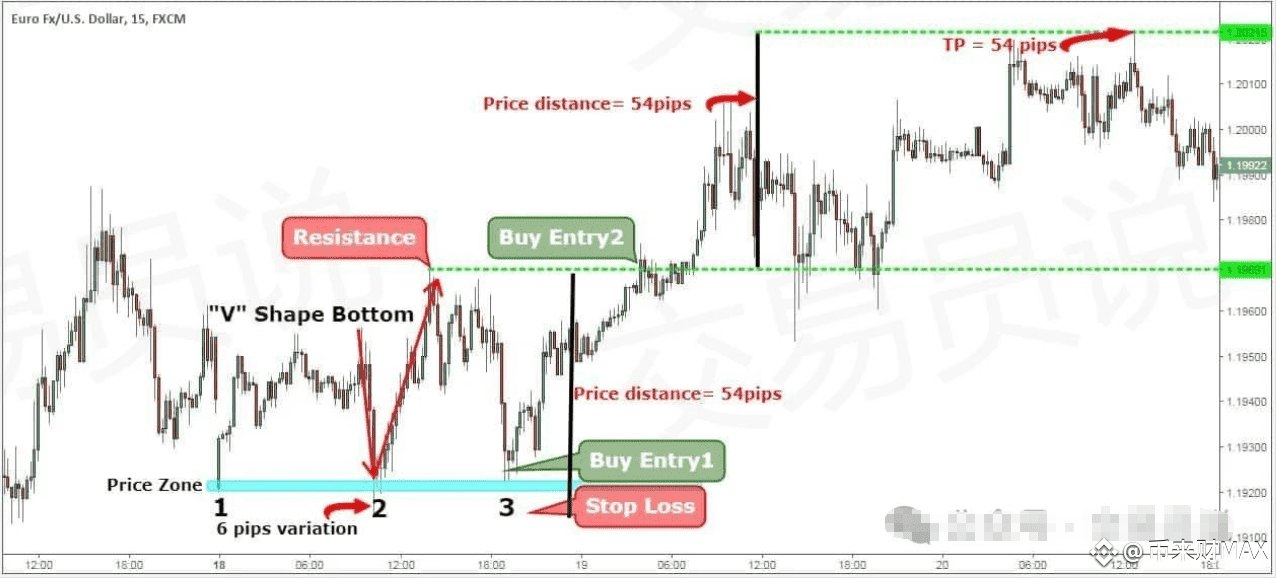
Step #2: Allow for a 10-15 point difference between the three tops.
The second criterion for a tradable triple top pattern is that there should be a difference of 10-15 points allowed between the three tops.
What does this mean?
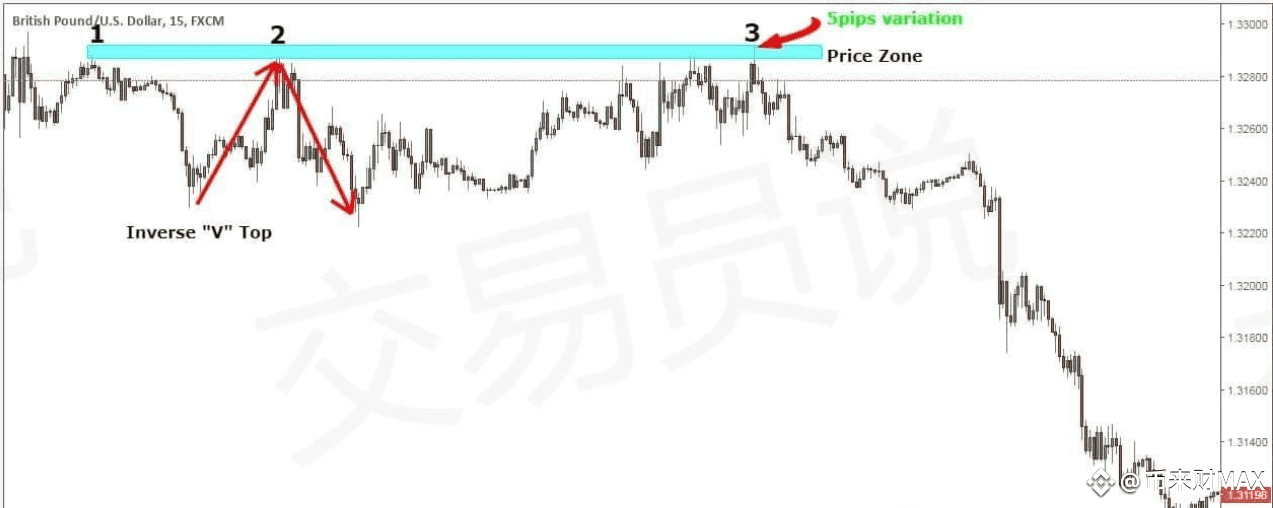
The probability of three tops appearing at the same price level is almost zero. You will find that these three tops usually have subtle differences, but they appear near the same price area.
More importantly, the closing price—if the position of the triple top pattern is good, the closing price may align perfectly. This is why we advocate letting go of an idealistic mindset.
Step #3: Enter at the third resistance test and re-enter when the support is broken.
If you want to take on more risk and are an aggressive trader, you can enter during the third resistance test, expecting the triple top reversal to occur. We prefer to spread the risk, entering half of the position during the third re-test and the other half when the support is broken.
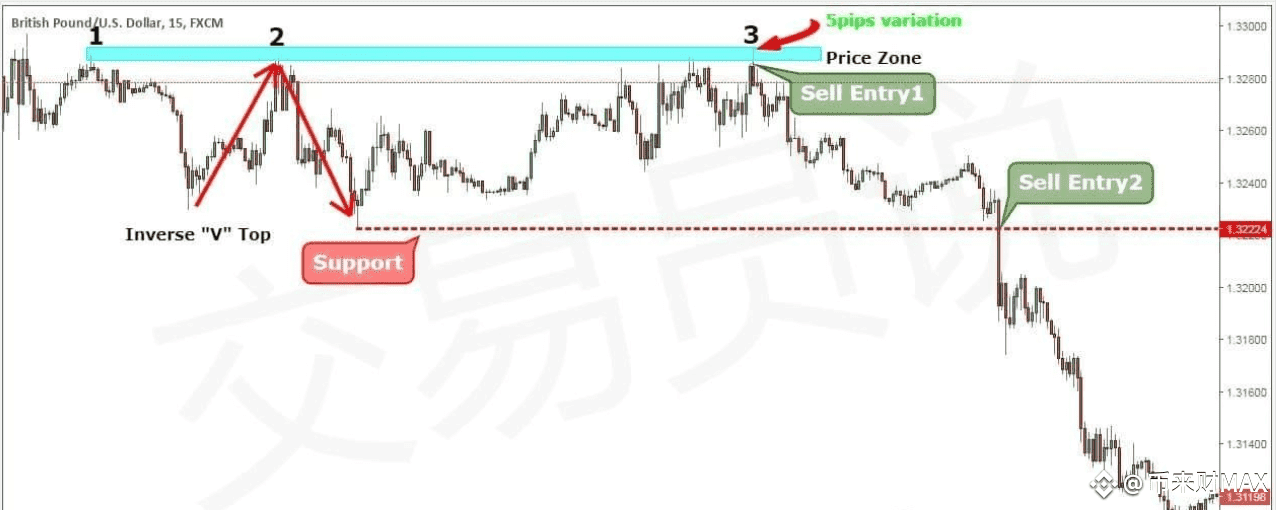
From the perspective of swing trading, you need to see signs of market sentiment shifting from bullish to bearish. This signal can only be provided by the support level breaking through the triple top reversal.
Note: The support level here is formed by the bottoms generated during the formation of the triple top pattern (similar to the 'neckline' in the head and shoulders pattern).
Next, we need to determine reasonable profit points for the triple top chart pattern trading strategy.
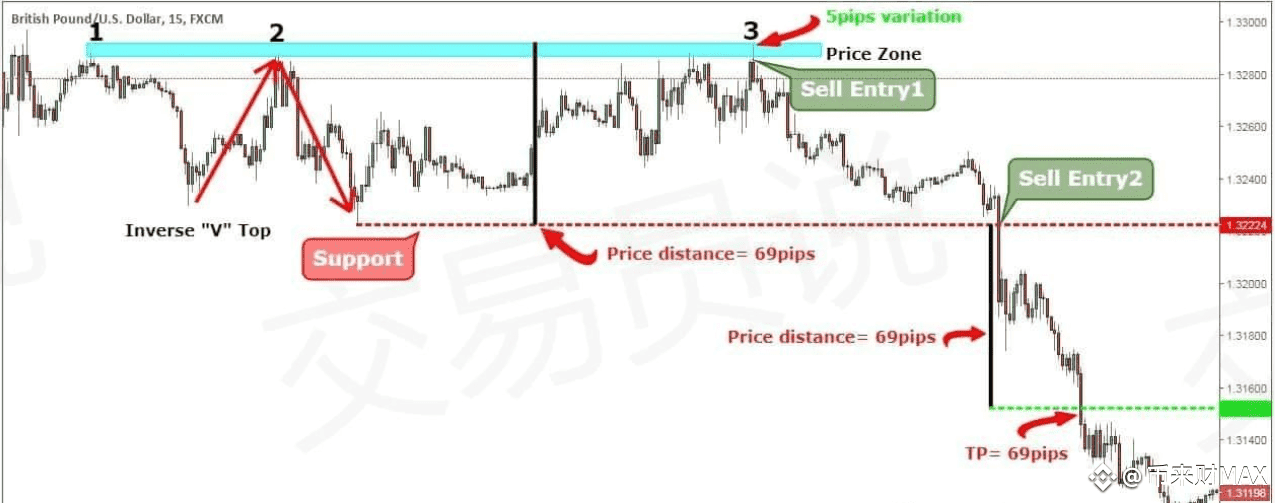
Step #4: The profit target equals the price distance from the highest point to the lowest point.
The average minimum decline after the breakout of the triple top reversal is approximately equal to the price distance from the highest point to the lowest point.
If we project the same price distance downward, we can obtain the first profit range of the triple top chart pattern trading strategy.
Next, we need to determine another important aspect: the placement of the protective stop-loss.
Step #5: Set the protective stop-loss slightly above the resistance level formed by the triple top pattern.
The triple top chart pattern trading strategy provides traders with a simple way to quantify risk because you can set the protective stop-loss slightly above the resistance level of the triple top pattern.
The key to trading the triple top pattern is to express opinions based on wise judgment while controlling risk as much as possible. You also do not want to use overly wide stop-losses.
Note: The above is an example of a short trade. For long trades, you can use the same rules in reverse. This time, we will use the triple bottom pattern. The chart below shows a real example of a buy trade using the triple bottom pattern.
Using Dow Theory in the reverse trading strategy of the triple top pattern.
'Trends will continue until a clear reversal signal appears' is an extremely important principle in Dow Theory. If you grasp this concept, you will be able to see whether a trend will continue or reverse, and thus determine the correct trading strategy.
For example, if in an uptrend, neither the latest high nor the latest low has moved up and is below the most recent low, it can be determined that the uptrend will reverse to a downtrend. Thinking in terms of Dow Theory helps improve the precision of reverse trading against the trend.
As mentioned earlier, the three 'peaks' of the triple top do not necessarily have to be of equal height; they may deviate somewhat. The key applied here regarding Dow Theory is the positional relationship between the highs. Once the highs begin to decline, a trend reversal may occur; if the lows also decline, the probability will significantly increase.
If the triple top appears near the market peak, it signifies the end of the uptrend. When interpreting the market, note that although the high has been tested three times upward, it has been blocked by the same resistance area level, and the final low moves down, causing the trend to reverse.
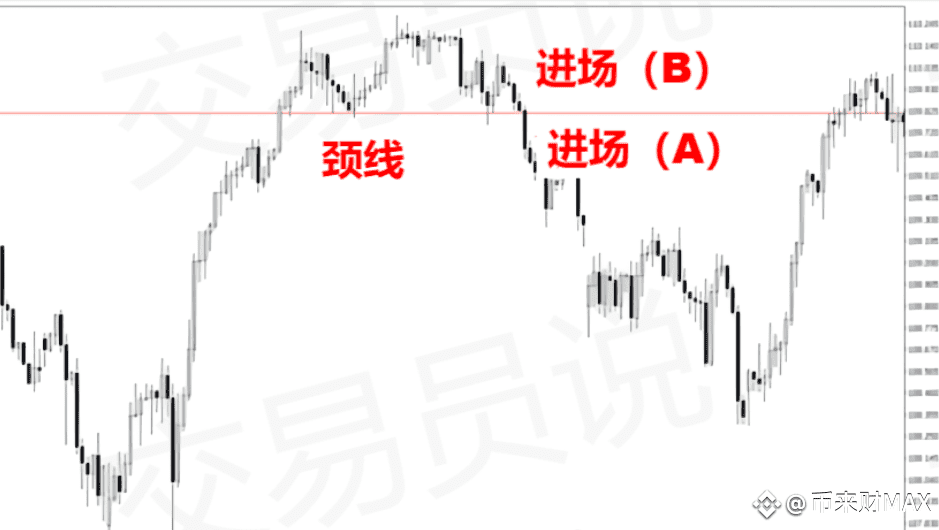
Similar to the head and shoulders, if the price breaks below the 'neckline', the decline will become more severe. Therefore, one should enter when the price breaks below the neckline. Additionally, if one can accurately anticipate that a triple top pattern will occur, they can choose to enter at the third peak.
Entry operation.
(A) Based on the conditions of an uptrend that complies with Dow Theory, after the triple top pattern forms, enter a short position when the price breaks below the neckline.
(B) Based on the conditions of an uptrend that complies with Dow Theory, after the triple top pattern forms, enter a short position at the third peak.
Summary
The triple top pattern does not appear as frequently as other chart patterns, but when it does, it can potentially provide you with substantial profits. Moreover, the triple top reversal is a very reliable price pattern, and we recommend trading it in intraday timeframes due to its higher frequency of occurrence.
The significance of the triple top chart pattern trading strategy lies in that it provides you with the opportunity to enter at the start of a new trend.
Additionally, when applying Dow Theory to trade triple tops or head and shoulders patterns, it is necessary to be familiar with the characteristics of various patterns to improve trading success rates.
If you also have tens of thousands of capital and want to try your hand in the cryptocurrency market but are afraid of pitfalls; if you have heard of 'dollar-cost averaging mainstream coins' and 'airdrop farming' but do not know how to operate specifically; if you want to understand 'how to choose potential coins' and 'should you increase or decrease your position when a bull market comes'—you might as well hit follow. Tomorrow I will break down the dollar-cost averaging plan, the three data dimensions to consider when selecting coins, and even the basic script logic for airdrop farming, teaching you step by step to avoid the pitfalls of 'blind gambling' and find a survival method in the cryptocurrency market that suits you.
The money in the cryptocurrency market is never 'gambled' but rather 'calculated.' Follow @币来财MAX and tomorrow we will continue to discuss how to ensure that every penny of your capital is on the right path.
