The market is facing selling pressure, which may lay the groundwork for price declines.

XRP has officially fallen below $3 today, becoming a bearish milestone that many did not anticipate. Its current trading price is about $2.92, after steadily declining from a high of over $3.70 in July. The trend is evident: $3 is no longer the bottom line as bulls are no longer dominant.
The price has now broken through the 26-day moving average, facing little resistance to downward pressure. During this pullback, trading volume remains moderate, which may indicate that there is no panic in the market, but also suggests little buying interest. The RSI is currently hovering around the 40s, indicating that momentum is weakening, having fallen below neutral, confirming the downward trend.
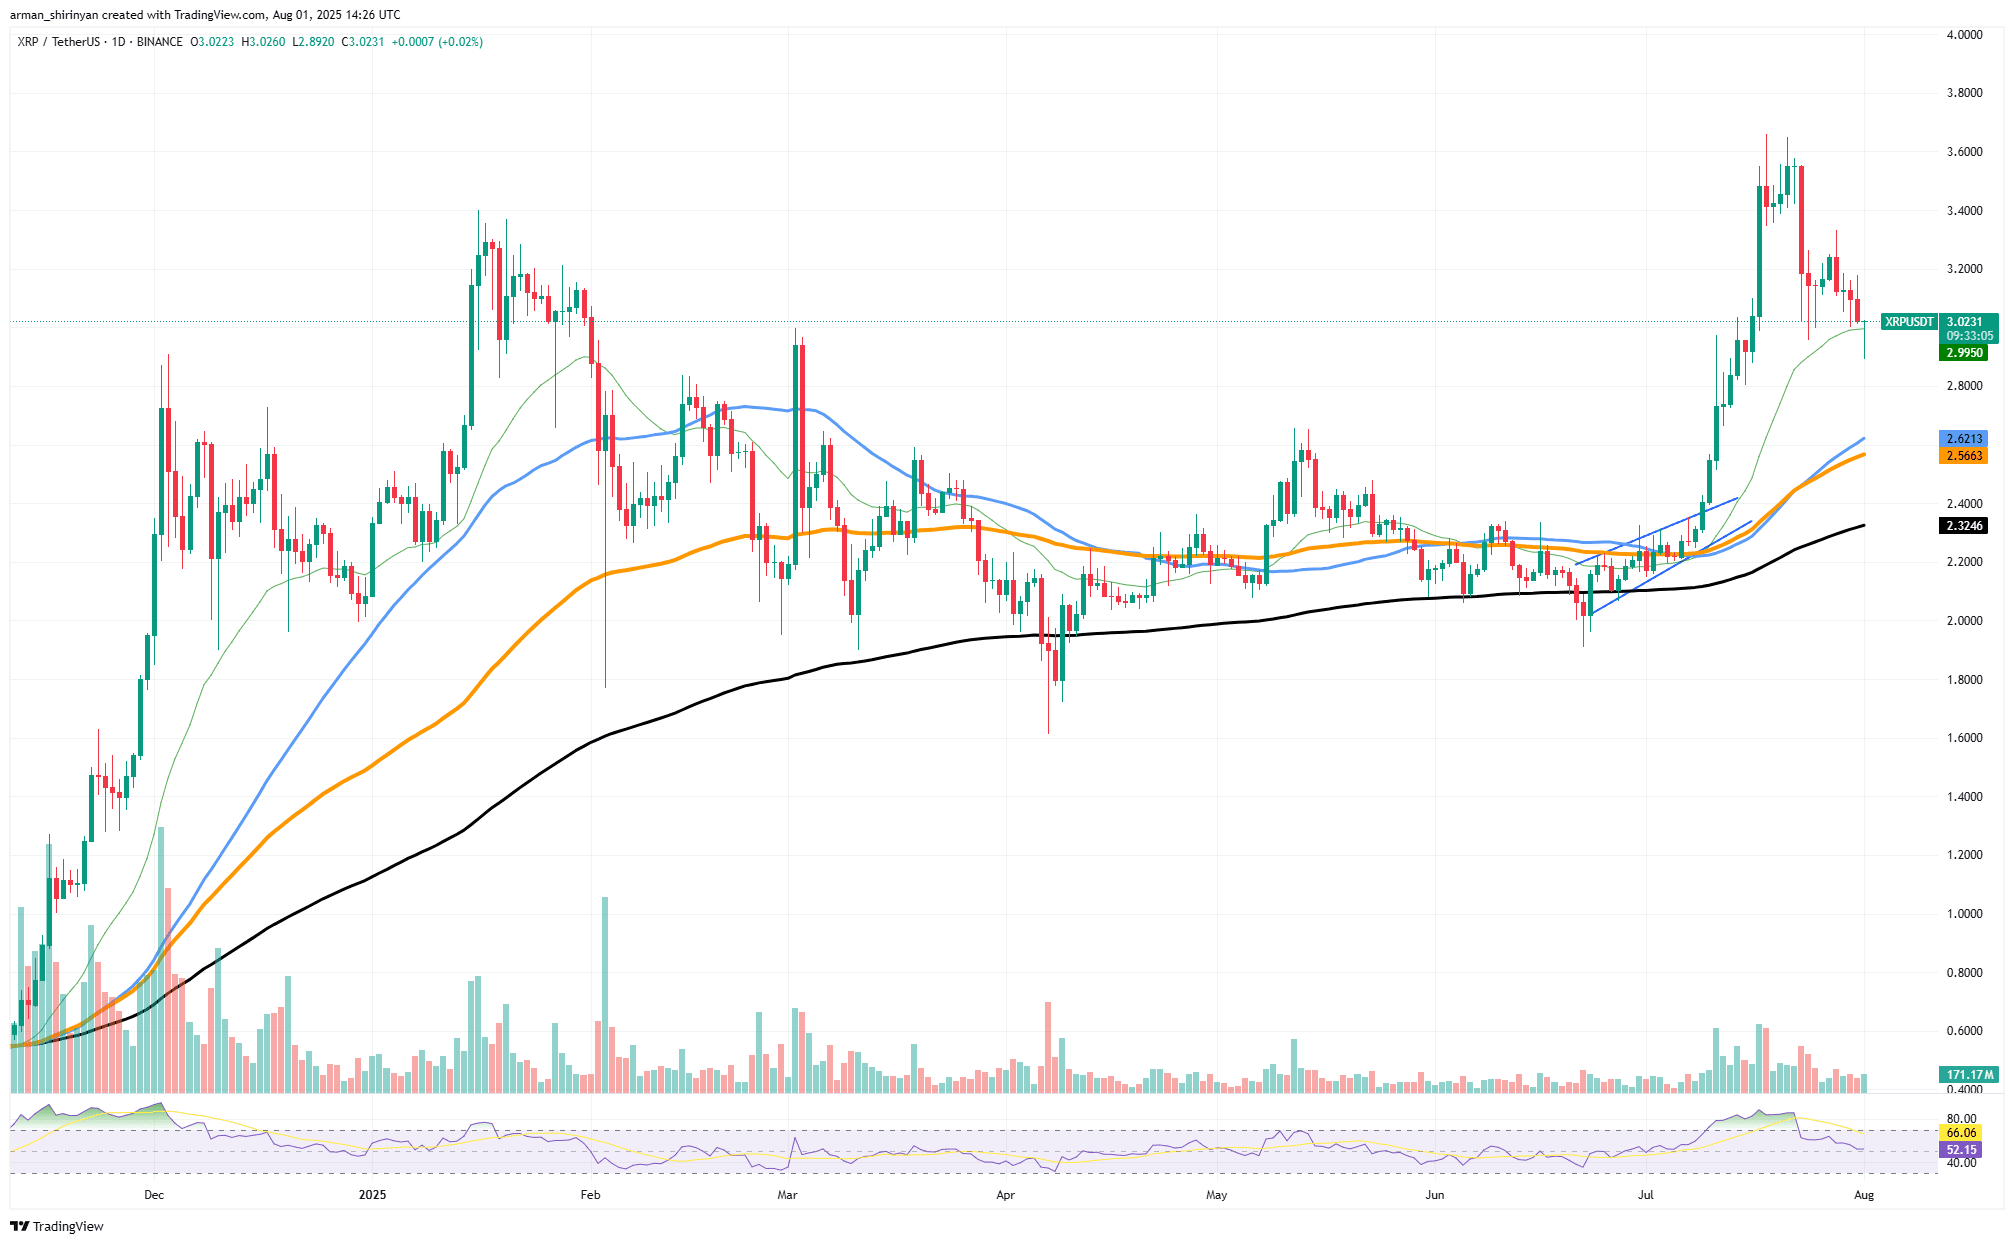
What does this mean for investors? First, the narrative of $3 needs to be discarded. While clinging to this threshold may prevent traders from seeing the true structure of the market, it is a crucial psychological milestone during the rebound process. A few retests have failed to hold $3, which should be seen as evidence that this area currently acts as a resistance level rather than a support level. A small historical support cluster and the 50-day moving average are converging in the $2.70-$2.60 area, which is the next area to watch.
If XRP finds support in the $2.30 to $2.20 range, it may retest that range, but if it falls below that level, it may stabilize. XRP's upward momentum has weakened. Holding above the $3 price tag will only delay rational position allocation. If buyers do not appear soon, the downward trend may intensify. Rather than holding the breached price point, it is better to adjust according to the chart trends.
Ethereum is under pressure.
Ethereum once reached just below $4,000 and has now entered a necessary correction phase. Given that the RSI indicator was overheated (peaking at 78, which is uncommon in trending markets), the recent downward trend is not entirely surprising. However, the 26-day moving average (EMA) is entering the market and may become the first significant support level since the breakout.
Ethereum has fallen nearly 10% from its local high and is currently trading close to $3,620. Despite the accumulation of bearish candles, this asset remains well above its key moving averages. The 26-day moving average is closing in rapidly. If the selling pressure begins to wane, the 26-day moving average (around $3,480) may provide a lifeline for ETH and present an opportunity for consolidation rather than further declines.
The volume curve shows that selling pressure continues to exist, but it has not surged, indicating that this is more of a market cooldown rather than a panic capitulation. Moreover, the RSI has fallen back to 61, taking ETH out of the danger zone and into a more neutral position, with the potential for a rebound.
If the 26-day moving average (EMA) holds, ETH may find new support or lay the groundwork for the next round of upward movement. Conversely, if the 26-day moving average (EMA) fails, the $3,000 level (where the 50-day moving average is located, historically a reliable support level during correction cycles) will become the next area to watch. Ethereum is currently essentially in a cooling phase, but has not collapsed.
The 26-day moving average is currently a crucial technical indicator, determining whether ETH can maintain a healthy correction or faces further downside risks. In the coming days, the $3,480 to $3,500 range should become the focus of attention.
Bitcoin plummets
The $120,000 threshold now looks more like a ceiling than a stepping stone, as Bitcoin has officially fallen below it. Due to the failure to break through the resistance level forcefully, Bitcoin's price has dropped over 7% from its local peak and is currently trading around $114,798.
At least for now, the retreat from this psychological threshold suggests a shift in bullish sentiment. The significant weakening of momentum is more concerning for bulls. Each attempt to break through $120,000 has led to shrinking volume, indicating a decline in buying interest. Bullish momentum is no longer effective, and the relative strength index (RSI) has dropped below 60, proving this point.
The 26-day moving average slightly above $111,800 is the next line of defense. In the recent upward trend of Bitcoin, this level has been a reliable short-term support. If Bitcoin can rebound significantly from the 26-day moving average, it may attempt to approach the resistance level again. However, if it fails to hold the resistance level, a pullback may extend further down to the 50-day moving average, which is around $107,000, where there may be stronger support. Currently, the level of $120,000 is still uncertain.
This rejection is not only technical but is also supported by macro factors such as the US economy regaining strength. Unless Bitcoin shows a strong rebound at the 26-day moving average support, investors should prepare for consolidation or further declines.
Without a significant rebound, it will be difficult to support another rise in the short term, but a rebound may maintain the bullish structure. To summarize: $120,000 has temporarily become history. Before investors start looking forward to new highs, Bitcoin must restore balance and maintain significant support levels.


