During the worst of the bear market in 2020, I had only $90,000 left in my account, staring blankly at the K-line after cutting three waves of altcoins—until one night I stumbled upon the tutorial on MACD bullish divergence.
The first gamble was Bitcoin: at $3800, the DIF line turned down below the zero line, and the green bars became shorter each time. Following the tutorial, I bottomed out with $20,000. Half a month later, the white line golden crossed above the yellow line, and the red bars exploded. The peak divergence signal popped out at $5800, clearing out and earning $50,000.
The real leap occurred during the 2021 Ethereum market: during the $1800 adjustment, the MACD formed a golden cross with decreasing volume above the zero line, and I put in $300,000. Watching the red bars explode from sparse to dense until the $4200 M head appeared, I cleared out everything on the death cross day—this wave alone rolled to $2.8 million.
The last key lock in the 2022 bear market: when SOL dropped to $10, the DIF line did not reach a new low while the price broke down, and the bullish divergence signal emerged. I built a position in three batches and added low leverage after confirming a golden cross above the zero line. This year, when I took profit at $120, my account steadily stood at 5.7 million.
It was only later that I realized those nights of liquidation weren't because the market was too fierce; it was because I didn't understand that the MACD red and green bars had already been shouting 'Run!'
1. Explanation of the MACD Indicator
1. Concept Definition
MACD (Moving Average Convergence Divergence) describes the relationship between two moving averages, consisting of a fast line and a slow line. Its main function is to judge and speculate on price trend changes or continuations.
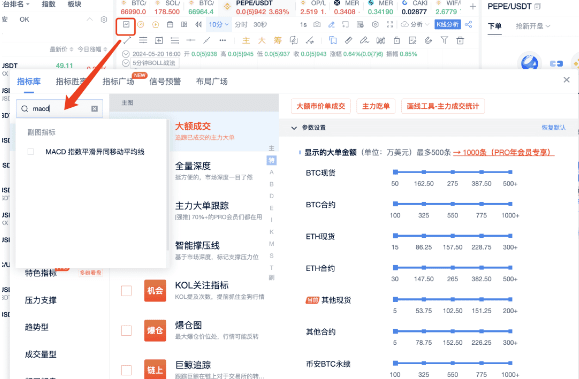
2. How to Enable the MACD Indicator
Open the indicator library, search for the MACD indicator and check it, and the MACD indicator will be displayed below. Taking BTC/USDT trading on Binance as an example, when the price is 66997.99, switch to the BTC 1-hour chart and set the MACD call 1 to spot. In the original parameter settings, the short cycle (N1) is 12, the long cycle (N2) is 26, and the DEA cycle (M) is 9. You can use the original settings without making too many changes.
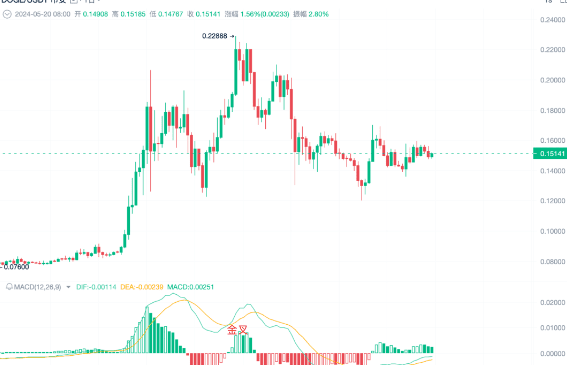
3. Green Line and Orange Line
1. Green Line (DIF, Fast Line): This is the difference between the short-term (12-period) EMA and the long-term (26-period) EMA. It reacts relatively sensitively to market changes and reflects market changes over a shorter time span.
2. Orange Line (DEA, Slow Line): This is the 9-period EMA of the DIF, which is relatively smoother and reflects market changes over a longer time span, lagging behind the fast line.
3. MACD Energy Bars: Displays the difference between the DIF and DEA. Through these three elements—green line, orange line, and energy bars—you can determine market trends and momentum changes.
2. MACD Golden Cross and Death Cross Trading Strategy
When the price is in a downtrend, and the fast line crosses above the slow line, a golden cross is formed, indicating that the trend may change from down to up, which is a trading opportunity to go long.
When the price is in an uptrend, and the fast line crosses below the slow line, a death cross is formed, indicating that the trend may change from up to down, which is a reasonable entry point for shorting.
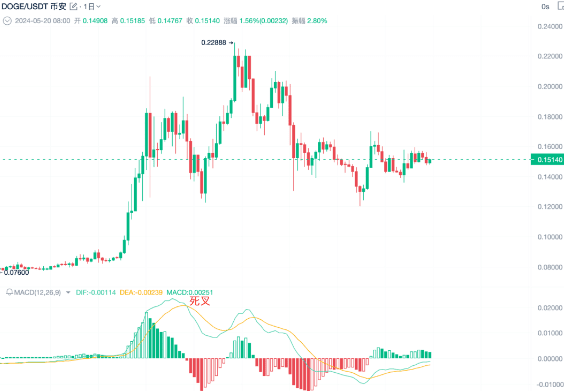
This is the traditional use of MACD.
3. MACD Divergence Trading Strategy
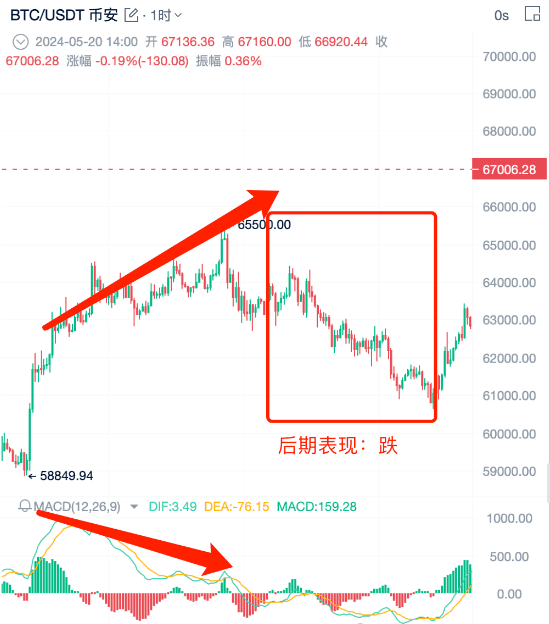
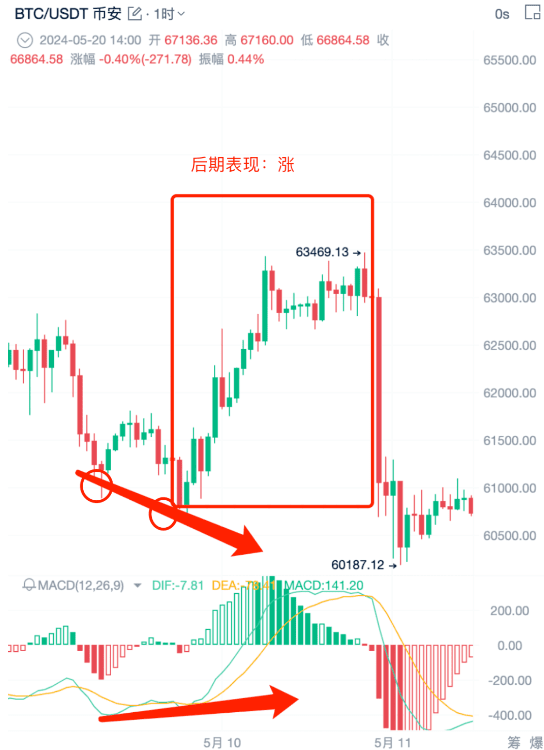
1. MACD Peak Divergence
When the price's high is higher than the previous high, this is peak-peak-high.
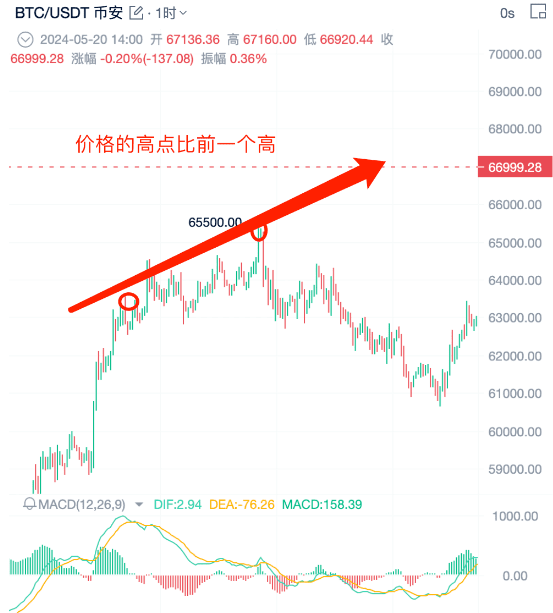
When the price's high is higher than the previous high, it forms peak-peak-high. Normally, the MACD should also form peak-peak-high to match the price trend momentum.
If the MACD forms a peak-peak-low at this time, it indicates that the price trend momentum shows signs of weakening.
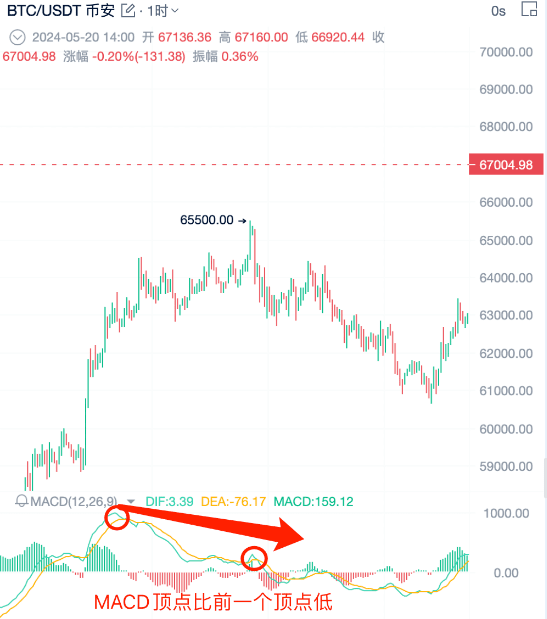
When the price forms peak-peak-high but the MACD forms peak-peak-low, this is peak divergence, and at this time, the price trend is likely to turn down.
To confirm the trend, it is necessary to find key price levels as well as MACD trend reversal divergence.
2. MACD Bottom Divergence
When the price's low is lower than the previous low, this is bottom-bottom-low.
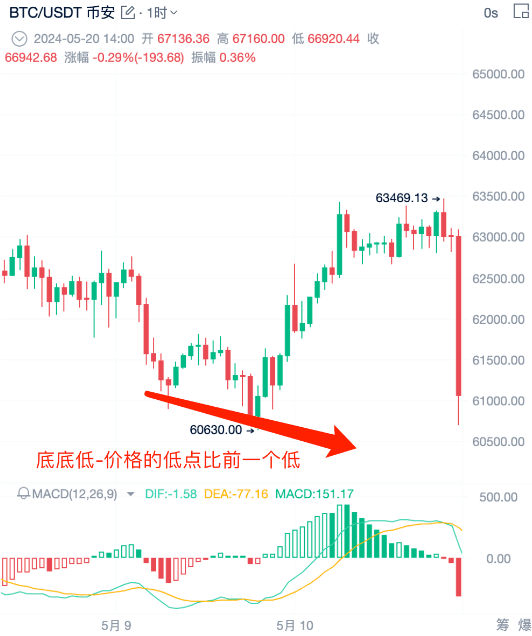
At this time, if the MACD forms a bottom-bottom-high, it means that buying momentum begins to enter, and the price's downward momentum gradually weakens.
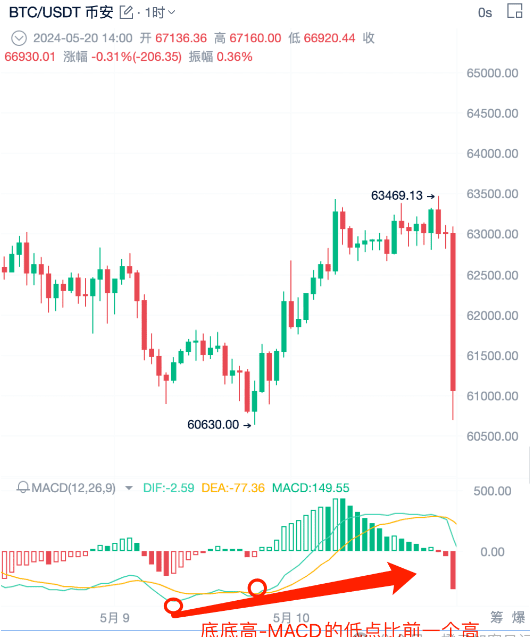
There is a high probability that the trend will change from a downtrend to an uptrend. When the price forms a bottom-bottom-low, but the MACD forms a bottom-bottom-high, this is a bullish divergence. When the bullish divergence is formed, it means that the trend will likely change to an uptrend, which is a reasonable buying opportunity.
3. MACD Trend Reversal Trading Strategy
Key price levels and MACD trend reversal divergence: find two peak connection lines while also identifying the corresponding two peaks on the bottom MACD.
Judging key support levels: when the price tests a certain support level multiple times and shows a significant rise, that support level is a key support level. When the price returns to the key support level again, you can look for trading signals to go long.
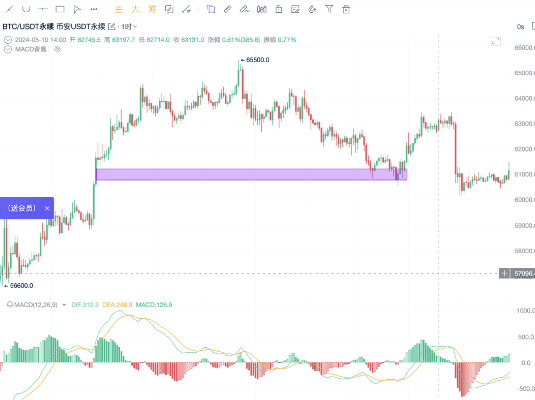
For example, we find a peak that has gone through a round of ups and downs and returned to the support level.
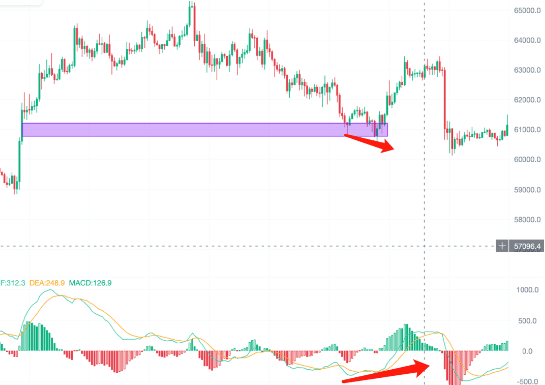
For example, when the price returns to the support level after a round of ups and downs, you still cannot directly go long; a signal is needed to confirm the effectiveness of the bullish divergence. You can draw a downward trendline, and if a descending wedge triangle (a bullish chart pattern) is formed, you can enter long when the price breaks through the descending wedge triangle.
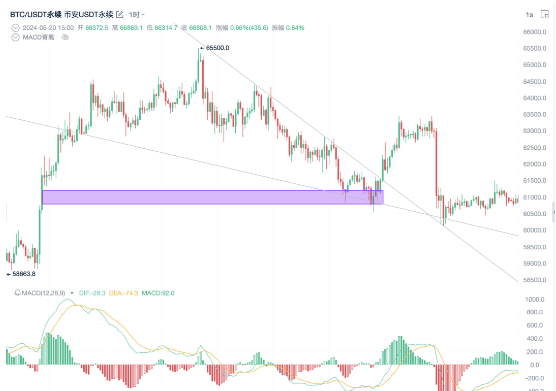
You can see that this is a descending wedge triangle, which is a bullish chart pattern. When the price breaks through this descending wedge triangle, we can enter long.
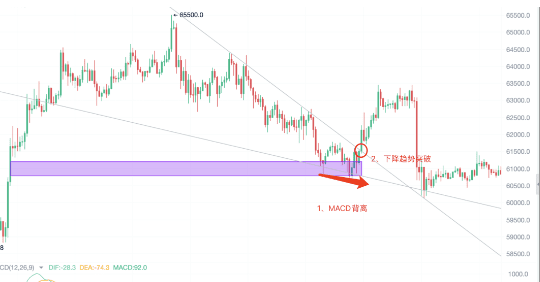
If both conditions are met, and the downward trendline is broken, one can consider going long. Draw a line at the previous high of the downtrend; when the price breaks through the previous high, it indicates a trend reversal, and the price is likely to change from a downtrend to an uptrend. You can enter long after the price breaks through the previous high. In summary, trading needs to combine key price levels and MACD trend reversal divergence. In short: key price levels + MACD trend reversal divergence.
4. How to Find Support Levels?
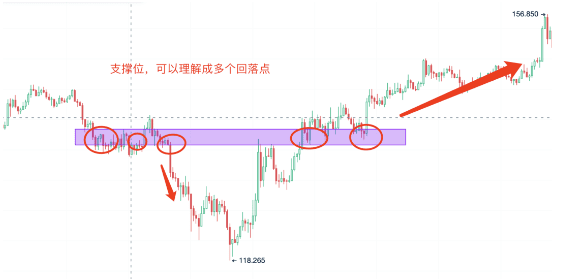
The support level can be understood as multiple retracement points that can form valleys or peaks, where the price will often test the foot of the mountain. The support level can be a small price range or a specific price point. At the same time, it is necessary to combine MACD divergence and key price levels to judge, focusing on whether the support level has been broken.
If you are also a tech enthusiast, feeling helpless and confused in trading, wanting to learn more about the cryptocurrency world and cutting-edge information, click on my profile to follow me, so you won't get lost!? Clarity in market trends gives you confidence in operations. Stably making profits is far more practical than fantasizing about getting rich.