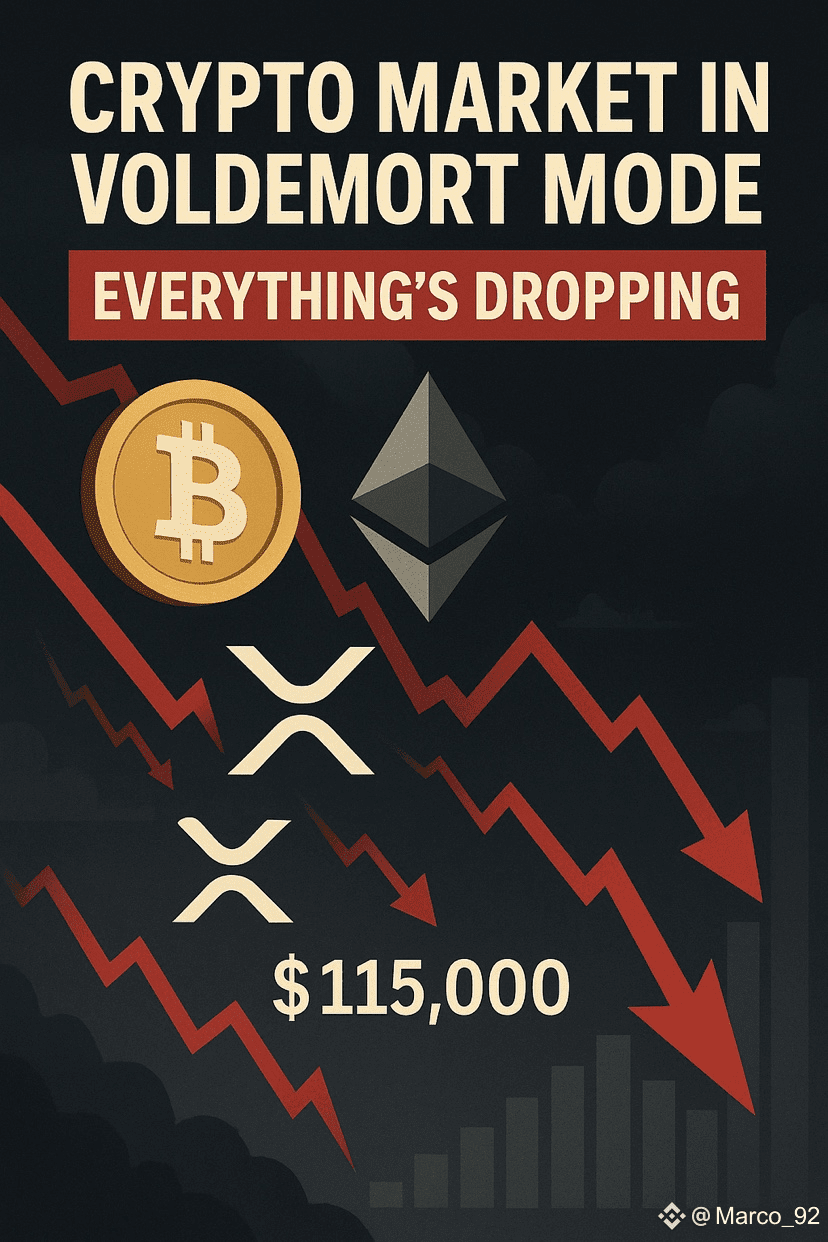
As of 2 August 2025, the crypto market**,** still riding the wave from July’s all-time highs, hit a synchronised sell-off. Major tokens across the board $BTC , $ETH , XPR and $SOL —took a hard fall as macro chaos, derivatives liquidation cascades, and waning institutional flows collided.
This is not retail-level panic—it’s a multi-dimensional decompression. Binance traders: buckle in. Here’s everything you need to know, with technical insight, risk metrics, and a framework to navigate the storm.
1. 🔧 Macro Catalysts: Tariffs, Rates, Risk-Off
On 1 August, President Trump announced sweeping U.S. trade tariffs—10% on global imports and as high as 35% on key partners like Canada—via executive order. Financial markets tumbled immediately: Bitcoin dropped ~3.2%, ETH ~2.5%, XRP and SOL up to 9.5% off early August highs; U.S. equities futures soldered ≈0.8% across the board.
That same day, weak July payrolls and downward revisions signalled labour market softening. The Federal Reserve held rates at 4.25–4.50%, prompting renewed fears of central bank “higher for longer” policy, which strained risk asset sentiment.
Combined, these shocks triggered a correlation breakdown: crypto—long behaving as a proxy for risk appetite—fell in lockstep with tech stocks and equities, dragging even larger alt-cap tokens down 5–8% in hours.
2. 📉 Derivatives Dynamics & Liquidation Cascade
Spot markets were only part of the story; over $1 billion was liquidated in major crypto futures within 24 hours, as leveraged longs were forcibly de-levered across Binance, OKX, and Bybit.
Glassnode data confirms broad unwind: BTC OI down ~11%, ETH ~23%, SOL ~6%, and memecoins hemorrhaged 52% open interest, typical in capitulation events.
The perp funding rate turned from neutral/positive to outright negative on SOL and memecoins—a signal that sentiment had flipped short-side and longs were collapsing, generating a funding-rate induced feedback loop amplifying price action.
Order book depth thinned, especially on higher leverage exchanges, accelerating slippage by 3–4x versus normal panic dips—liquidity vacuum + cascading margin calls drove the velocity and tissue-thin spread environment.
3. 🌊 On‑Chain & Institutional Flows: Where Has Demand Gone?
Ethereum, historically buoyed by spot ETF inflows, saw remarkable demand in July: > $900 million in net ETF purchases, comprising 29% of all net inflows year-to-date; BitMine Immersion alone bought over 566 k ETH ($2 billion) in mid-July.
Yet even ETH flows cooled sharply by early August, as risk-aversion seeped into institutional allocations. Bitcoin ETF demand similarly softened after days of outflows over $200 million/day, curbing systematic “buy-the-dip” behavior, though BTC still commands deeper liquidity and ETF interest.
Glassnode also highlights realised cap outflows across Ethereum and memecoin cohorts, a stark turnaround from H1’s influx-driven rallies.
4. 📊 Technical & Volatility Structure
BTC broke beneath $116 K quickly turned support into resistance; historical Short-Term Holder (STH) cost basis sits at approximately $92.5 K, with downside risk toward the $71–75 K band if distribution accelerates.
For ETH, the lack of fresh inflows turned $3,400–3,600 into resistance, while liquidity clusters around $3,200–3,300 and a hard stop below $3,000 triggers open liquidations and rising theta decay in options.
Implied volatility (5d VVIX) across ETH and BTC options crushed overnight as vol spiked 35-50%, risking an implied drawdown of 3–5% on aggressive long gamma strategies before recovery.
5. 🧠 Trader Battleplan: Risk, Levels & Tools
✅ Risk Framework
Limit open exposure to 10–15% notional per major position
Set far-corner stop-loss near liquidity clusters: BTC ~$113 K, ETH ~$3,020
Avoid over-leveraged perp entries; focus on grid DCA and spot–hedged.
🎯 Tactical Levels
BTC: watch $116 K–$118 K zone for bounce–sell opportunities; mid-range $112 K–$120 K; downside target $110 K or lower if support fails.
ETH: $3,200–3,400 is key pivot zone. Unexpected strength may trigger a bounce over $3,500. Below $3,000 risks systematic stop triggers.
🛠 Binance Tools
Spot Grid Bot: structure ladders between $3,200–$3,500 for ETH or $112 K–$118 K for BTC.
Mirror Trading Strategies: hedge spot buy with short w/ inverse perpetual.
Auto-Savings + ETH Staking: compound long-term conviction during dip.
Binance Convert: institutional depth helps control slippage in thin volatility windows.
6. 🔄 Why ETH & BNB Still Make Sense
ETH, despite the crash, continues to attract inflows into spot ETFs and large corporate treasuries. Look for positive ETH/Coinbase premiums to signal resumed institutional appetite.
BNB, with tight bonds to Binance exchange usage and deep orderbook, remains less correlated with broader altcoin weakness. Historical patterns show BNB outperformance during volatile pullbacks.
🔚 Final Word
What’s happening now is not just a dip—it’s a market structural purging: macro shock, derisking, liquidation cascades, and fading on‑chain inflows all converged. The result is compressed FF volatility, narrower execution depth, and a guardrails-free “freefall” phase. Yet for disciplined traders, this is a strategic inflection point. Tools like spot–hedged rebalancing, tight stop-loss architecture, and institutional-grade execution offered by Binance can transform chaos into controlled opportunity. Protocol rule: In a macro shock, capitalize on flows forgotten—but always hedge the gamma. All data sources cited; not financial advice. Always assess your risk tolerance and verify before execution.


