Whether you trade crypto, stocks, or forex, success comes down to timing, analysis, and discipline.
One of the best tools you can use is chart pattern recognition.
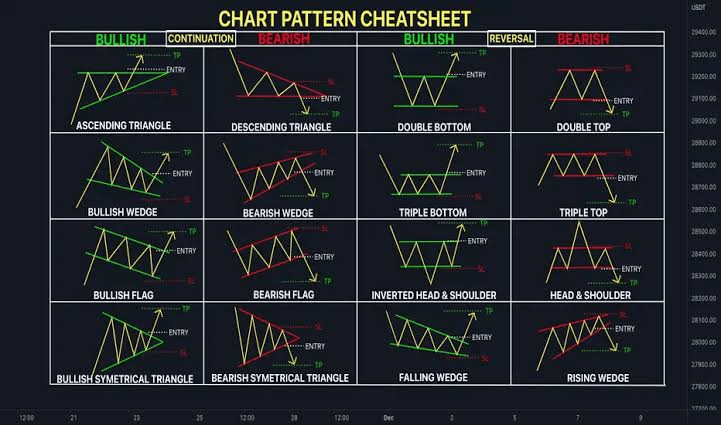
The chart you shared shows 16 powerful patterns divided into: ✅ Bullish patterns (market likely to go up)
❌ Bearish patterns (market likely to go down)
🔄 Reversal patterns (market might change direction)
If you learn these and use them well, you can increase profits and reduce losses.
---
🔍 What Are Chart Patterns?
Chart patterns show how buyers and sellers behave in the market.
These patterns repeat over time and help predict where the price might go next.
---
🚀 Bullish Patterns – When to Buy
Bullish patterns mean the price might rise.
You should buy (go long) after the pattern breaks above resistance.
Examples:
Ascending Triangle
Bullish Flag
Bullish Wedge
Falling Wedge
Double Bottom
Triple Bottom
Inverted Head & Shoulders
Bullish Symmetrical Triangle
Simple strategy:
✅ Entry: After breakout above resistance
🛡 Stop-Loss (SL): Just below the recent low
🎯 Take-Profit (TP): Previous high or target based on pattern size
---
📉 Bearish Patterns – When to Sell
Bearish patterns mean the price might drop.
You should sell (go short) after the pattern breaks below support.
Examples:
Descending Triangle
Bearish Flag
Bearish Wedge
Rising Wedge
Double Top
Triple Top
Head & Shoulders
Bearish Symmetrical Triangle
Simple strategy:
✅ Entry: After confirmed breakdown below support
🛡 SL: Just above the recent high
🎯 TP: Previous low or target based on pattern size
---
♻️ Reversal Patterns – Spot Trend Changes
These show when the market might switch direction.
Examples:
Double Bottom → Bullish reversal
Inverted Head & Shoulders → Bullish reversal
Double Top → Bearish reversal
Head & Shoulders → Bearish reversal
---
📈 How to Maximize Profits with Chart Patterns
Here are 7 easy tips to help you trade better:
1. Wait for Confirmation
Don’t guess! Only enter when there’s a real breakout/breakdown with higher volume.
2. Plan Before Trading
Decide your entry, stop-loss (SL), and take-profit (TP) before you place the trade.
3. Use Risk-Reward Ratio (RRR)
Aim for at least 1:2. For every $10 you risk, try to make $20.
4. Check Volume & Indicators
Confirm your pattern using tools like RSI, MACD, moving averages, and watch for strong volume.
5. Practice First
Try trading patterns on past charts or a demo account before risking real money.
6. Focus on Higher Timeframes
Patterns on 1-hour, 4-hour, or daily charts work better than on 5-minute charts.
7. Don’t Overtrade
Only trade when the setup is strong. Better to take a few good trades than many weak ones.
💡 Conclusion:
Chart patterns help you:
✅ Find trades early
✅ Avoid bad trades
✅ Lock in profits
✅ Cut losses faster
The best traders don’t rush. They wait for good patterns, make a plan, and stick to it.
#TrendingTopic #PATTERN #MarketPullback
#TrumpTariffs #crypto