Bitcoin (BTC) is down on Friday, dropping below $115,000 for the first time since July 25. The inability to crack the resistance at $120,000 for over three weeks now puts the BTC price uptrend in question, at least for the near term.
Will Bitcoin price drop to $104,000?
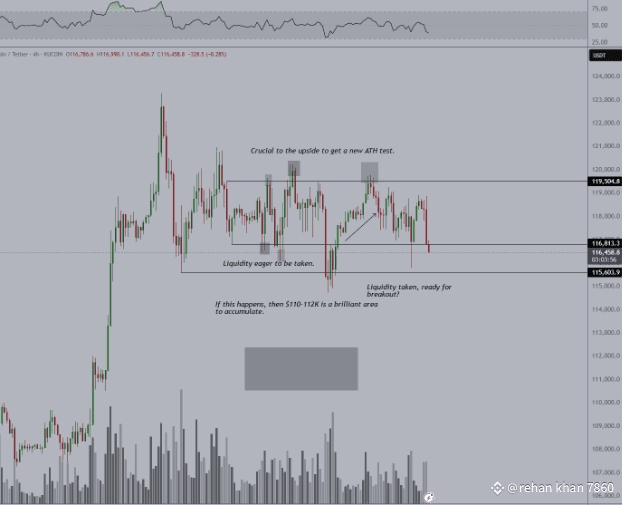
Bitcoin is flirting with downside volatility as it clings to the $115,000 support level, an area market analyst Michaël van de Poppe flagged as essential to continue the uptrend.
His chart shows that BTC’s drop below $115,600 could trigger a cascade of long-side liquidations and push the price back toward the $110,000–$112,000 region.
Data from Cointelegraph Markets Pro and TradingView shows that Bitcoin dropped to an intraday low of $114,100 on Friday. This price action was accompanied by $172 million long BTC liquidations, per CoinGlass data.
As Cointelegraph reported, the odds of a deeper correction to $104,000 will increase if the $116,000 level is not reclaimed shortly.
Bitcoin’s divergence hints at $92,000
Adding to the short-term bearish bias, Bitcoin’s weekly chart is flashing a classic bearish divergence between price and momentum.
The chart below shows that while BTC/USD formed higher highs over recent months, the relative strength index (RSI) has carved out lower highs, suggesting waning bullish momentum
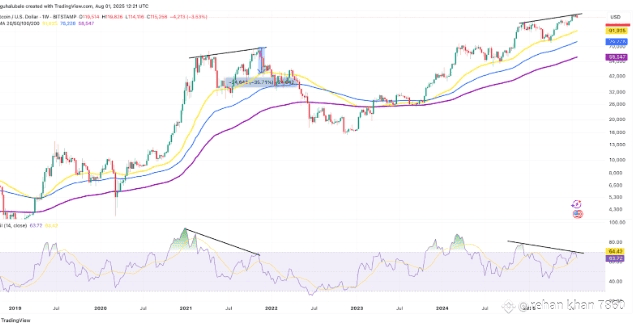
Such a signal often precedes deeper pullbacks, as it did ahead of the 2021 market top.
If history repeats, BTC could retrace toward its 50-week exponential moving average (50-week EMA; the yellow wave), currently near $92,000. This trendline also served as key support during previous bull markets, making it a logical target for any mid-cycle correction.

