What does XRP breaking below $3 mean for its price momentum?
The breaking of $3 by XRP marks a significant technical shift, as it closed below the middle line of the Bollinger Bands on its daily chart for the first time since the breakout in July. This middle line is located around $3.19, which has provided support during the price decline, but its breakdown indicates that XRP is losing upward momentum and is seeking new support levels. The current support level is near the lower Bollinger Band at about $2.76, suggesting potential further downside pressure in the future.
How do the Bollinger Bands indicate XRP's volatility and trend changes?
The Bollinger Bands expanded during XRP's recent rise and are now contracting, indicating that volatility is cooling. This narrowing typically suggests that prices will experience significant fluctuations. With the middle line support disappearing, XRP may test the lower band, which could become a key support area. This technical formation reflects that the market is in a transitional phase, and bulls may face challenges in maintaining control.
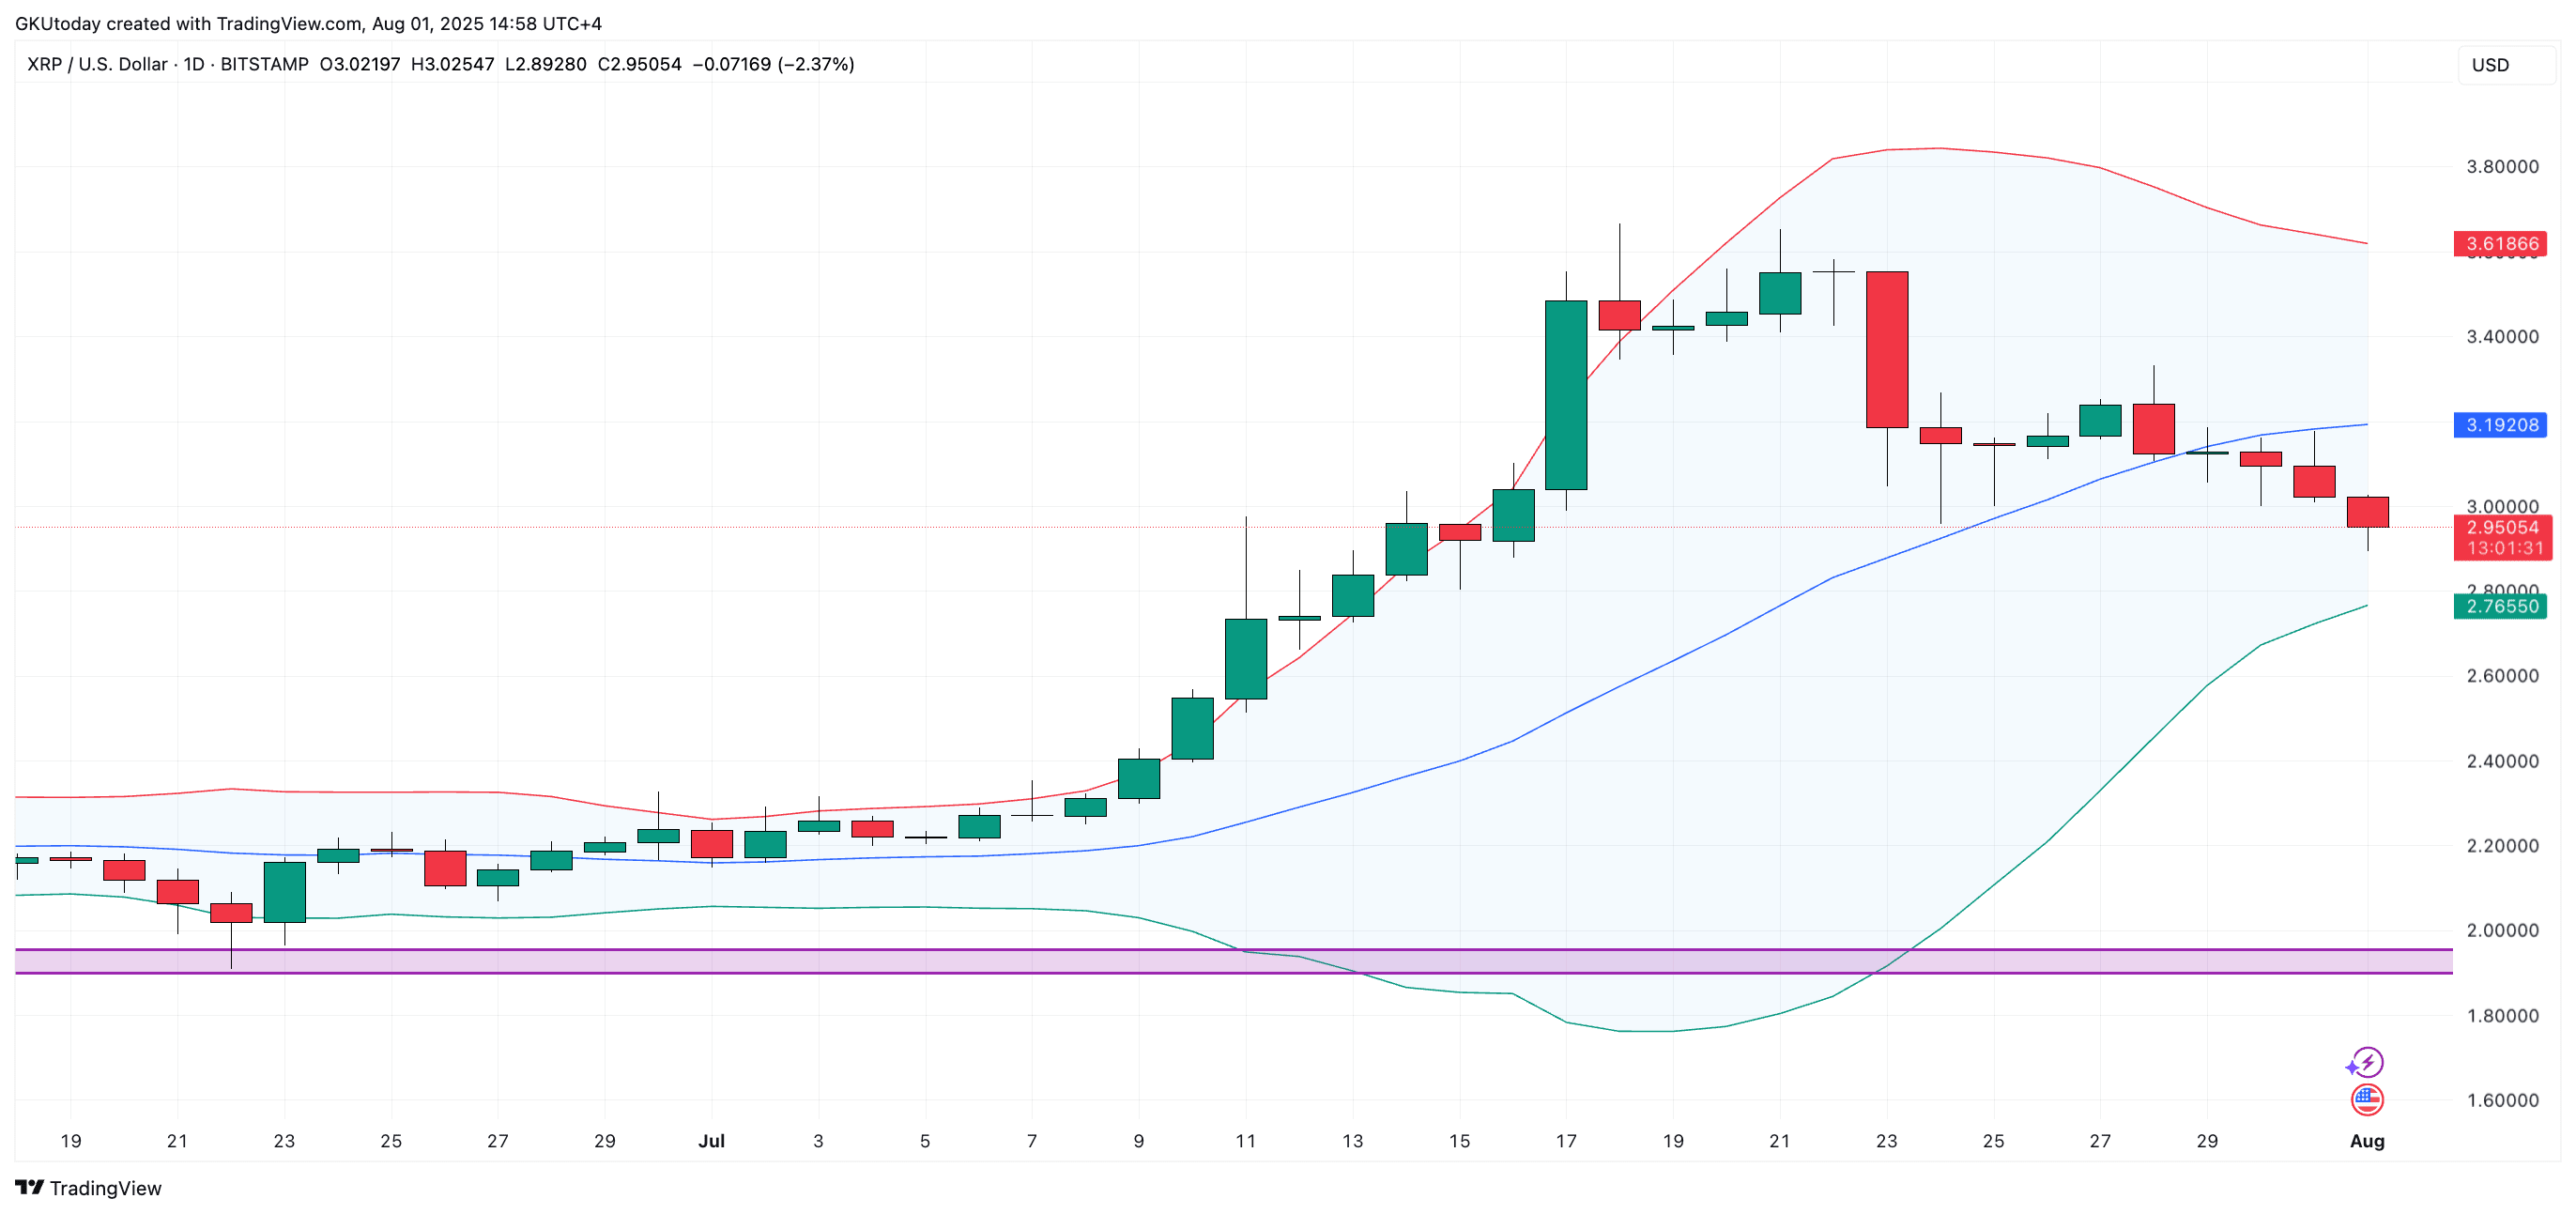
Source: TradingView
Is XRP facing a 20% drop on the weekly chart?
The weekly Bollinger Bands chart shows that XRP is not experiencing a free-fall decline but is displaying signs of diminishing momentum. XRP is about to close with its second consecutive bullish candle, and the price has fallen below the upper Bollinger Band region. Currently, the weekly middle line is near $2.39, representing a potential support level, indicating that XRP could drop about 20% from its current level.
While this does not necessarily mean a crash is imminent, technical indicators suggest that the cooling phase of XRP may last longer than bullish investors expect. Downward pressure may persist until XRP returns above the 20-day moving average.
What does this mean for XRP investors and traders?
Investors should closely monitor the Bollinger Bands, as a break below the lower band could trigger further selling. Conversely, a rebound from this support level may signal new bullish momentum. COINOTAG's expert analysis emphasizes caution, advising traders to look for confirmation signals before making significant adjustments.
Frequently Asked Questions
What technical indicators suggest a decline in XRP's price?
The decline in XRP's price is primarily manifested as the daily chart shows a break below the Bollinger Bands middle line and the narrowing of the Bollinger Bands, indicating reduced volatility and the possibility of further declines.
How should traders respond to XRP's current trend?
Traders should focus on testing support around $2.76 and $2.39 and seek confirmation before entering, as the market shows signs of cooling momentum and potential further declines.
Key Points
XRP has broken below the $3 middle line of the Bollinger Bands, indicating a loss of upward momentum.
As the Bollinger Bands narrow, volatility is cooling, indicating a potential decisive price movement may occur soon.
The weekly chart indicates XRP could drop by as much as 20%, testing the support level near $2.39.
Conclusion
XRP's recent drop below $3 highlights a shift in market momentum, with the Bollinger Bands indicator suggesting a potential further decline of up to 20%. Investors and traders should closely monitor support levels and volatility indicators. COINOTAG will continue to provide expert analysis to help you navigate these market changes.
Continue to monitor TREE SC MEME INIF