
Bitcoin has adjusted about 2.4% in the past 24 hours, maintaining above 115,000 dollars. While traders remain cautious, a bullish pattern could determine whether Bitcoin breaks strongly to 150,000 dollars or risks losing momentum.
The Outflow Cash Ratio Indicates Lower Selling Pressure
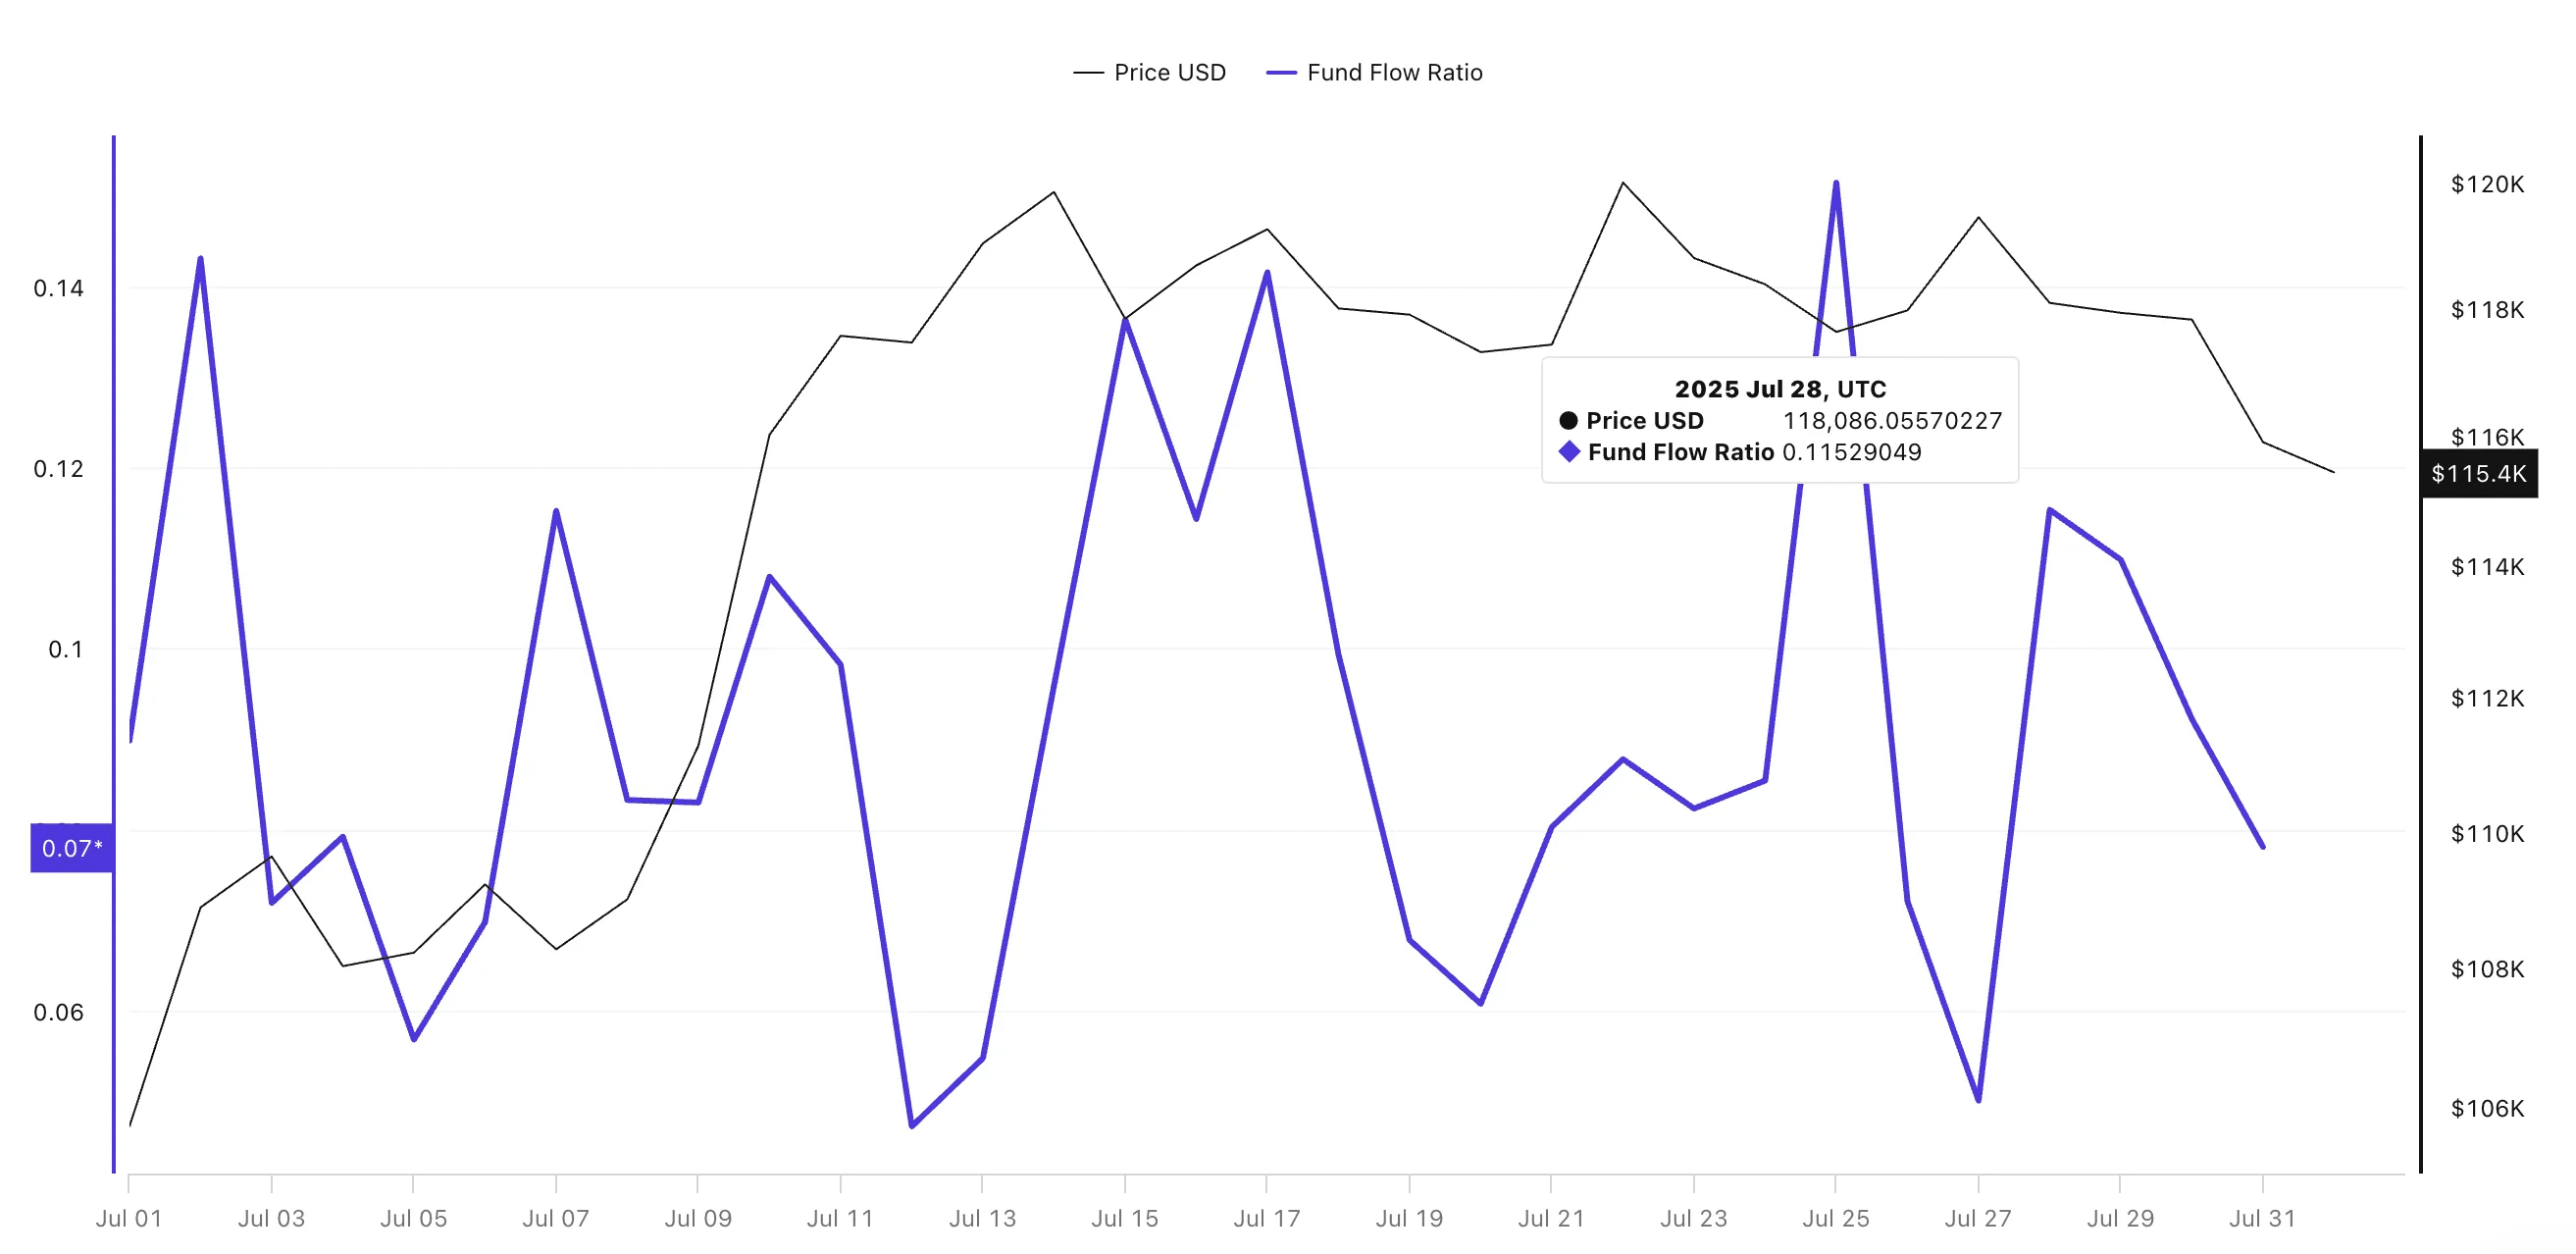
The Fund Flow Ratio (FFR) measures the number of coins moved to and from exchanges compared to the total number of on-chain transactions. A higher ratio usually indicates increased trading activity on exchanges, often associated with selling. A decreasing ratio means fewer coins are being moved to exchanges, signaling that immediate selling pressure has decreased.
Over the past two weeks, this ratio has changed significantly:
At the beginning of July, the price reached 0.15, matching the recent peak of Bitcoin at nearly 120,000 dollars, indicating a higher potential for selling.
By July 28, the price had dropped to 0.11, forming a lower peak. (The first lower peak since early July, when the price surged)
At the time of writing, this ratio has dropped to 0.07. This downward trend in the Fund Flow Ratio indicates that fewer large investors want to sell. Money is being held in wallets or moving away from exchanges, creating a potential supply shortage, which could help fuel a breakout if buying pressure increases.
For updated market information and technical analysis of the token: Do you want to know more details about this token? Subscribe to Editor Harsh Notariya's Daily Cryptocurrency Newsletter here.
CMF Divergence Indicates Quiet Accumulation
The Chaikin Money Flow (CMF) is an indicator that tracks buying and selling pressure based on both price and volume. Higher CMF values indicate strong inflows, while decreasing CMF values signal outflows.
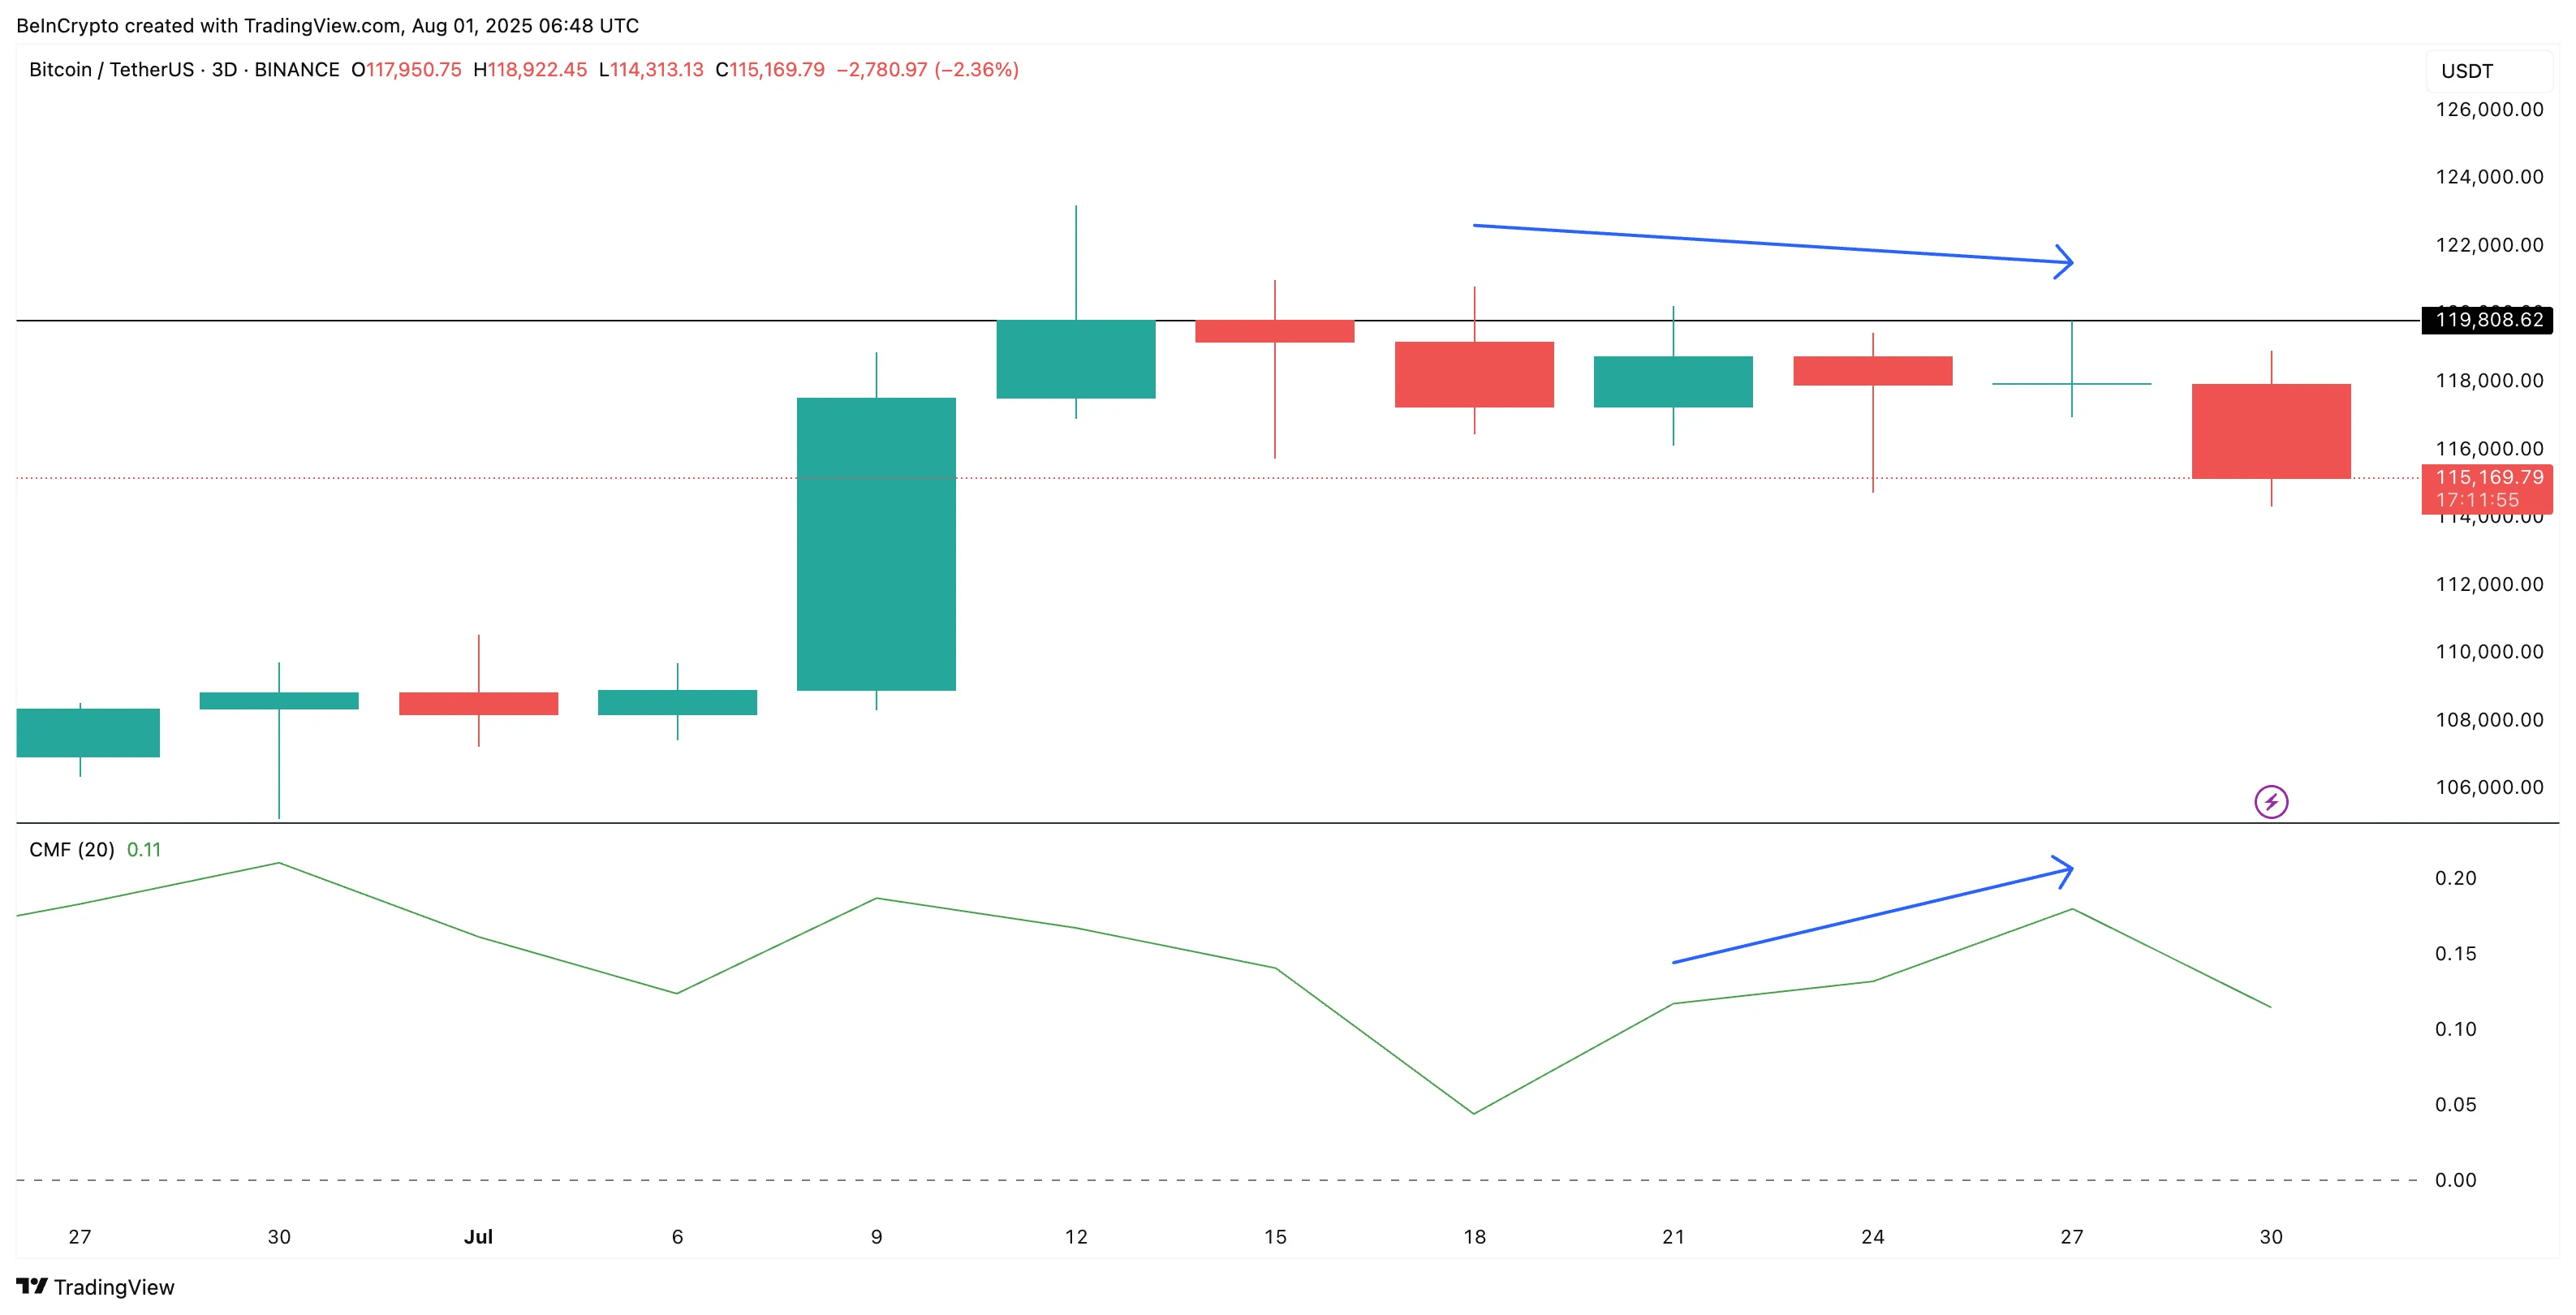
On the 3-day chart, a bullish divergence has formed:
The price has reached lower levels since mid-July.
At the same time, the CMF has reached higher levels.
This divergence is significant because it indicates that money is still flowing into Bitcoin despite the price drop.
The choice of the 3-day chart is intentional; it reduces noise from daily volatility and false breakouts, providing a clearer view of the positions of large investment funds. Higher timeframe divergences like this often lead to strong directional moves when resistance levels are broken.
Currently, the CMF is around 0.11 and if it moves up from here, forming another higher peak, we may receive bullish confirmation for the pattern breakout.
Bullish Pennant Pattern Holds the Key to Bitcoin's 150,000 USD Price Level
The 3-day chart shows classic pole and flag structure:
Pole: Strong 25% increase earlier this month.
Flag: A period of consolidation following the price surge.
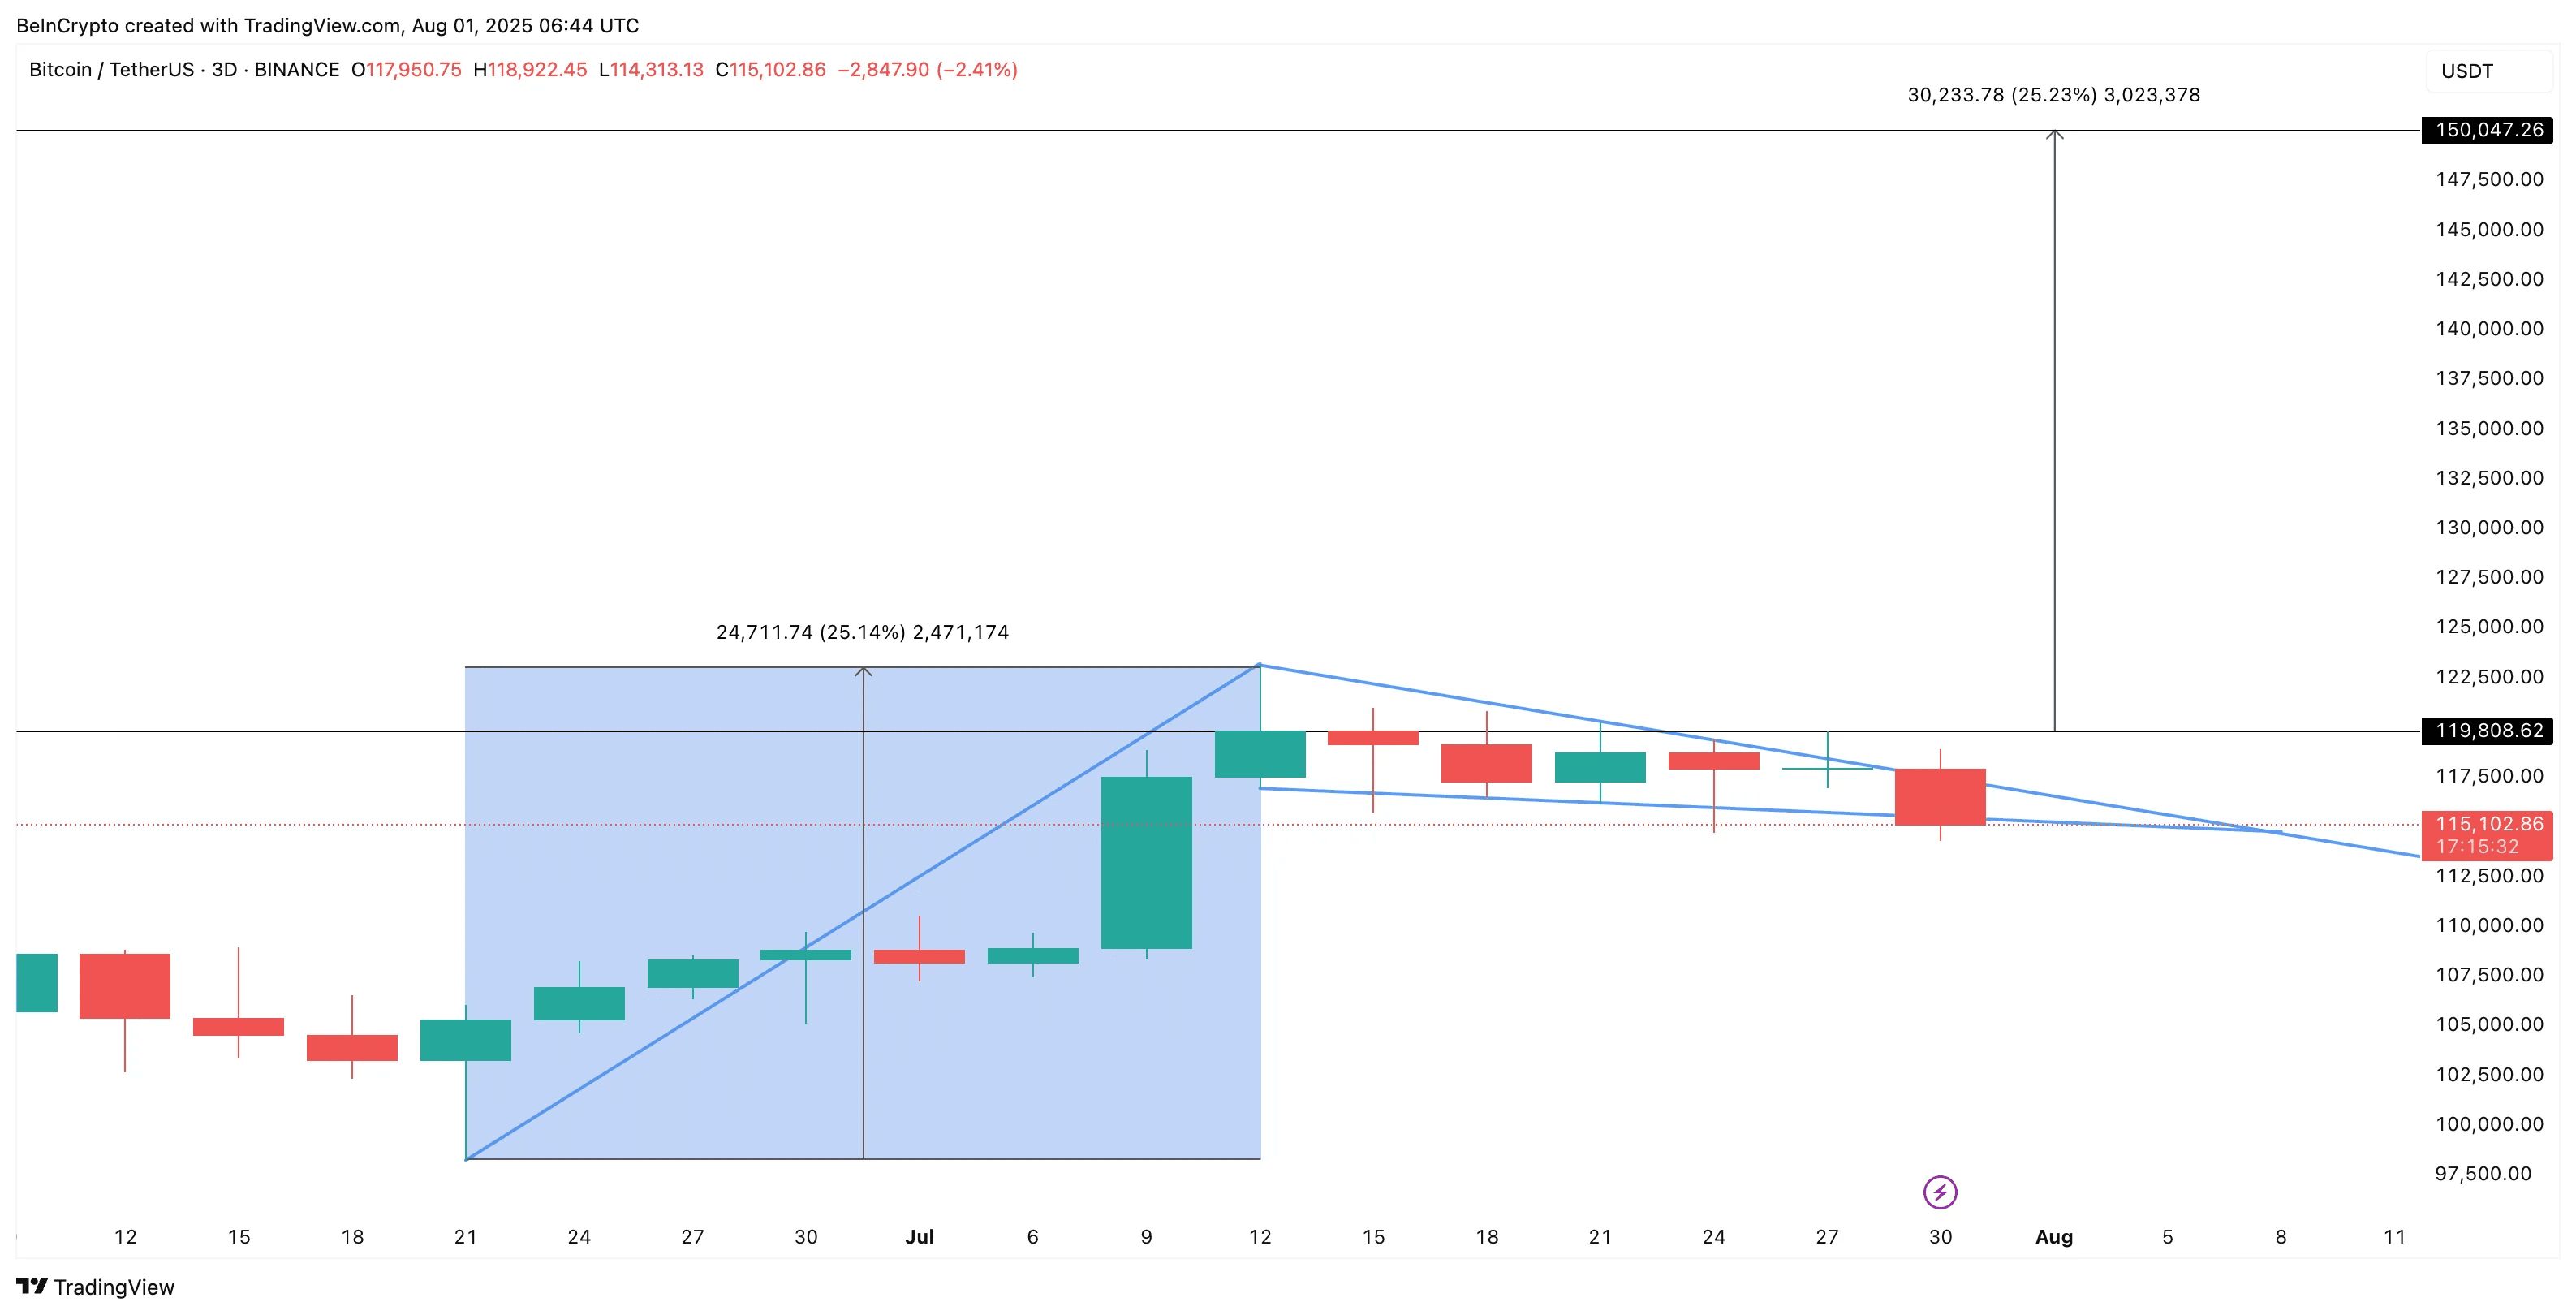
This setup often signals the continuation of an uptrend if resistance levels are broken. Bitcoin has broken out multiple times, with long wicks above and below the trendline quickly being pulled back due to high volatility.
Note: While standard structures and patterns can be invalidated after two false breakouts, structures based on poles have a larger margin for error. In most cases, bullish structures fail if the price drops near 50% of the height of the pole. Therefore, the bullish pennant pattern currently remains valid as long as the support level of 114,000 dollars is upheld.
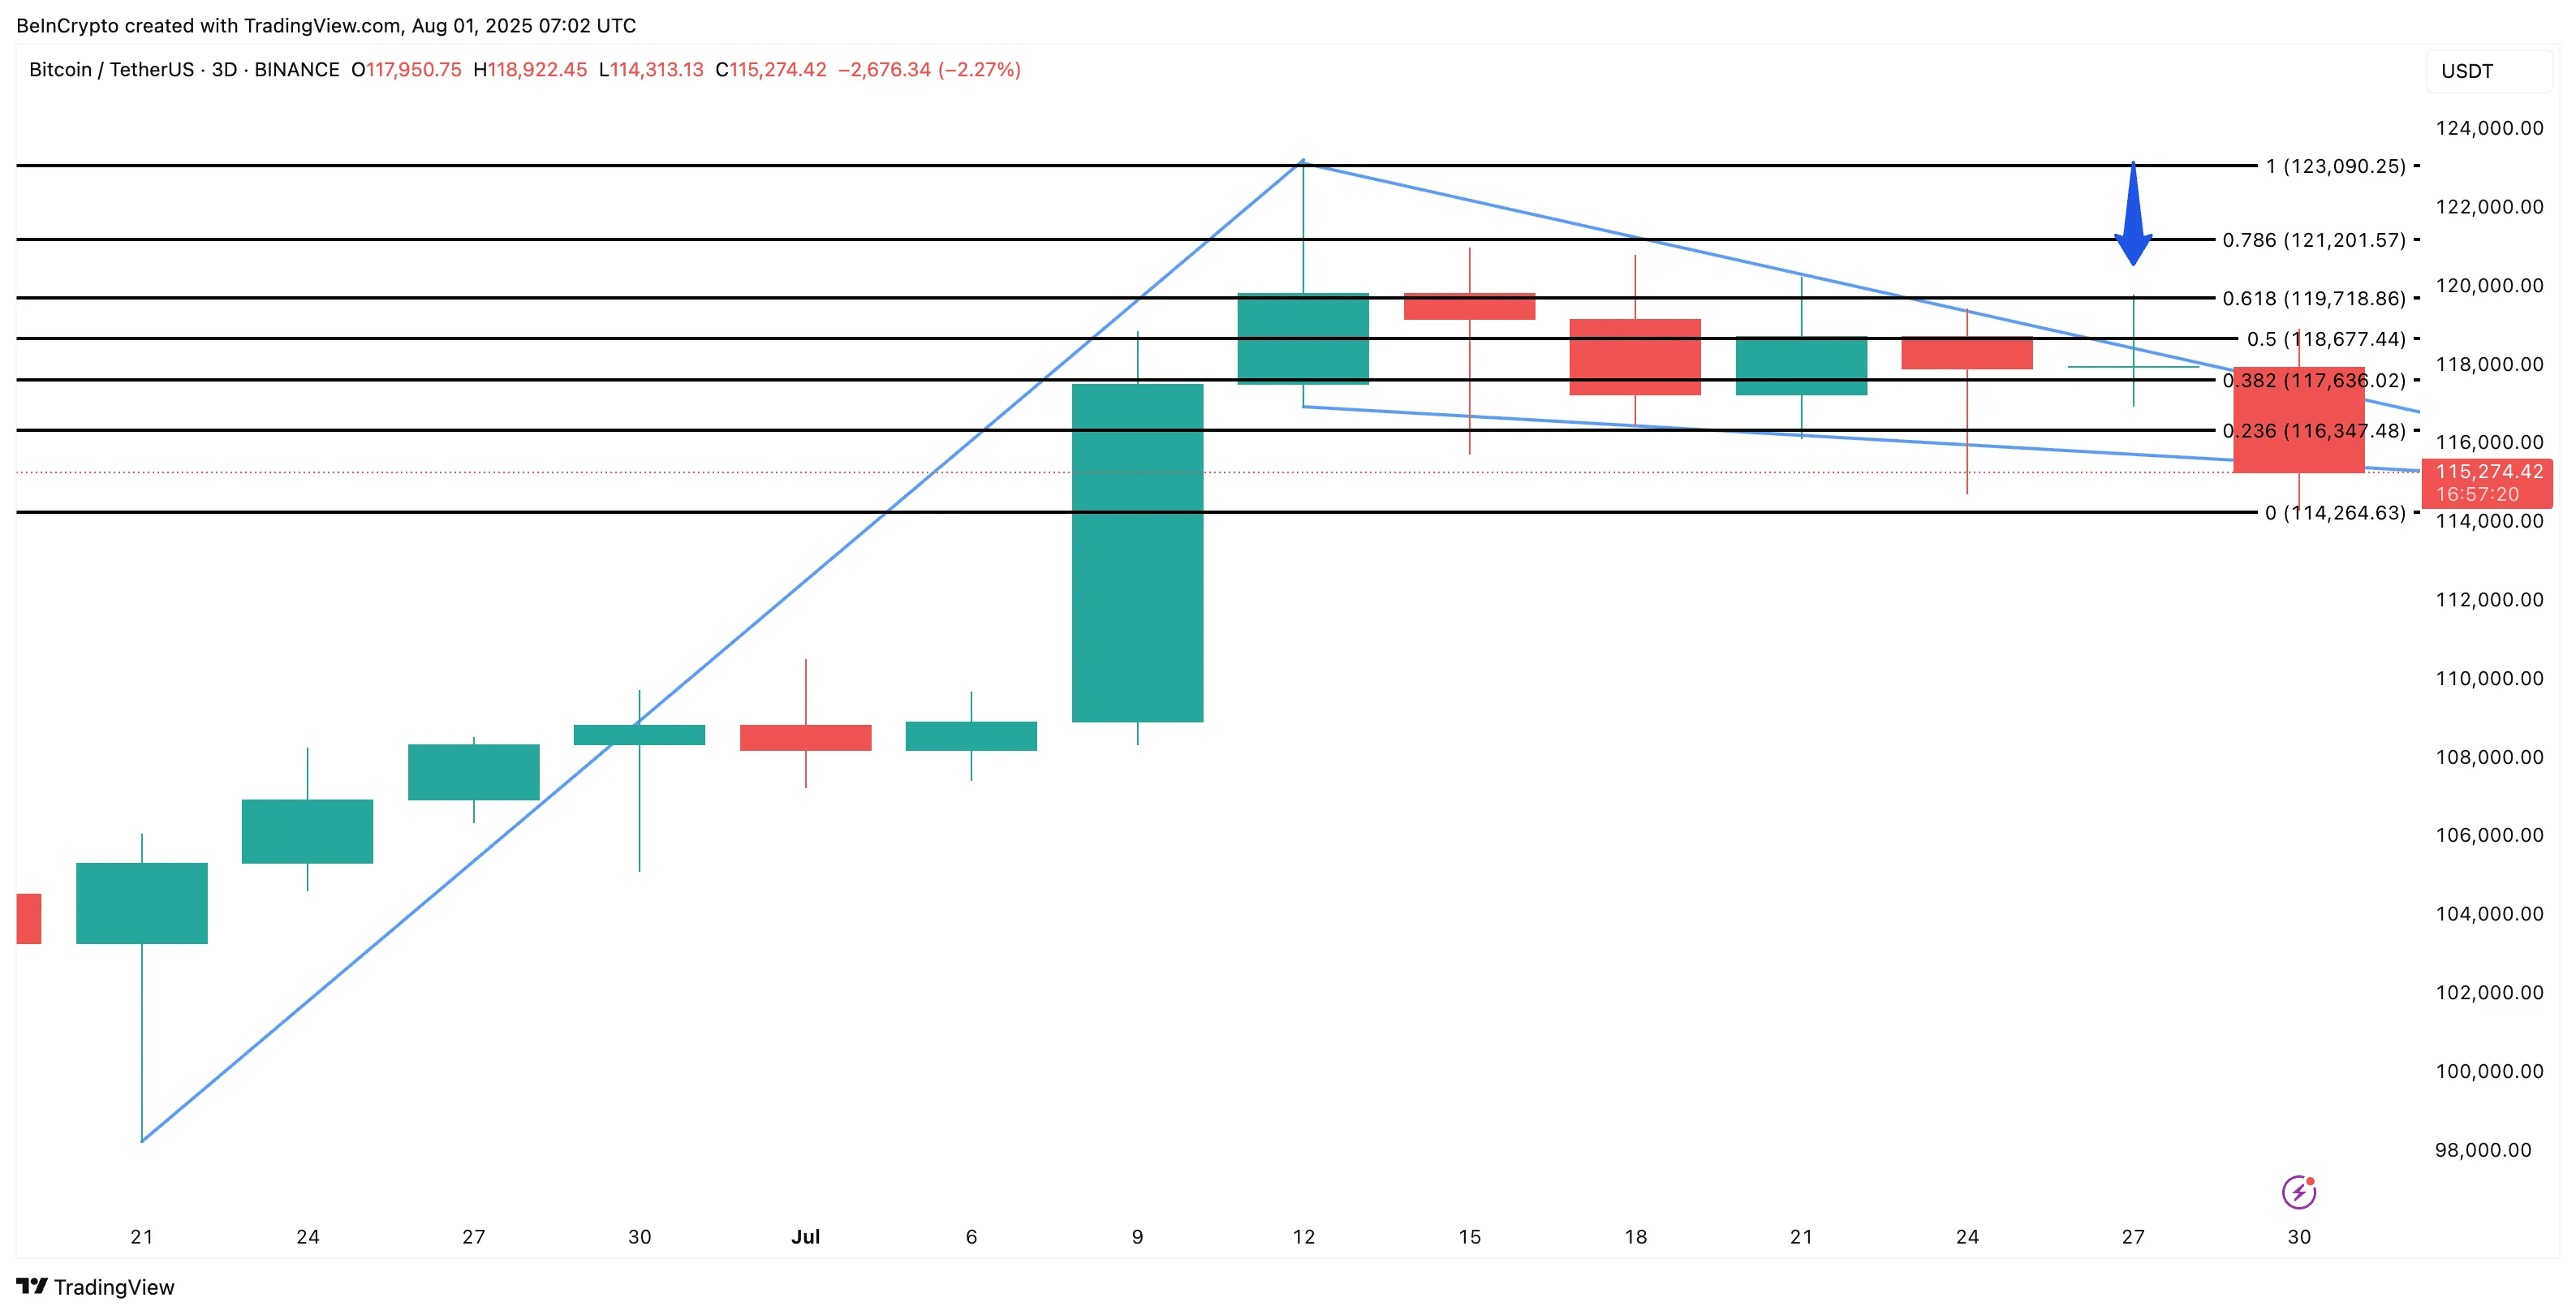
A confirmed 3-day round candle closing above 119,000 dollars (the highest failed breakout point) could trigger the next upward momentum. Based on measured extreme volatility, a 25% breakout from this level could push Bitcoin to about 150,000 dollars, consistent with long-term bullish expectations.
Bitcoin's next major move depends on a unique technical setup. The bullish flag pattern, supported by decreasing outflows from exchanges and stronger inflows along the 3-day CMF, paints a positive picture for the bulls. But it all depends on price action:
Above 119,700 dollars: Opens up bullish opportunities towards 150,000 dollars.
Below 114,000 dollars: Bullish trend fails and downside risk increases.