

@BounceBit #BounceBitPrime $BB
🔎 Technical analysis of BBUSDT (6H timeframe, Binance)
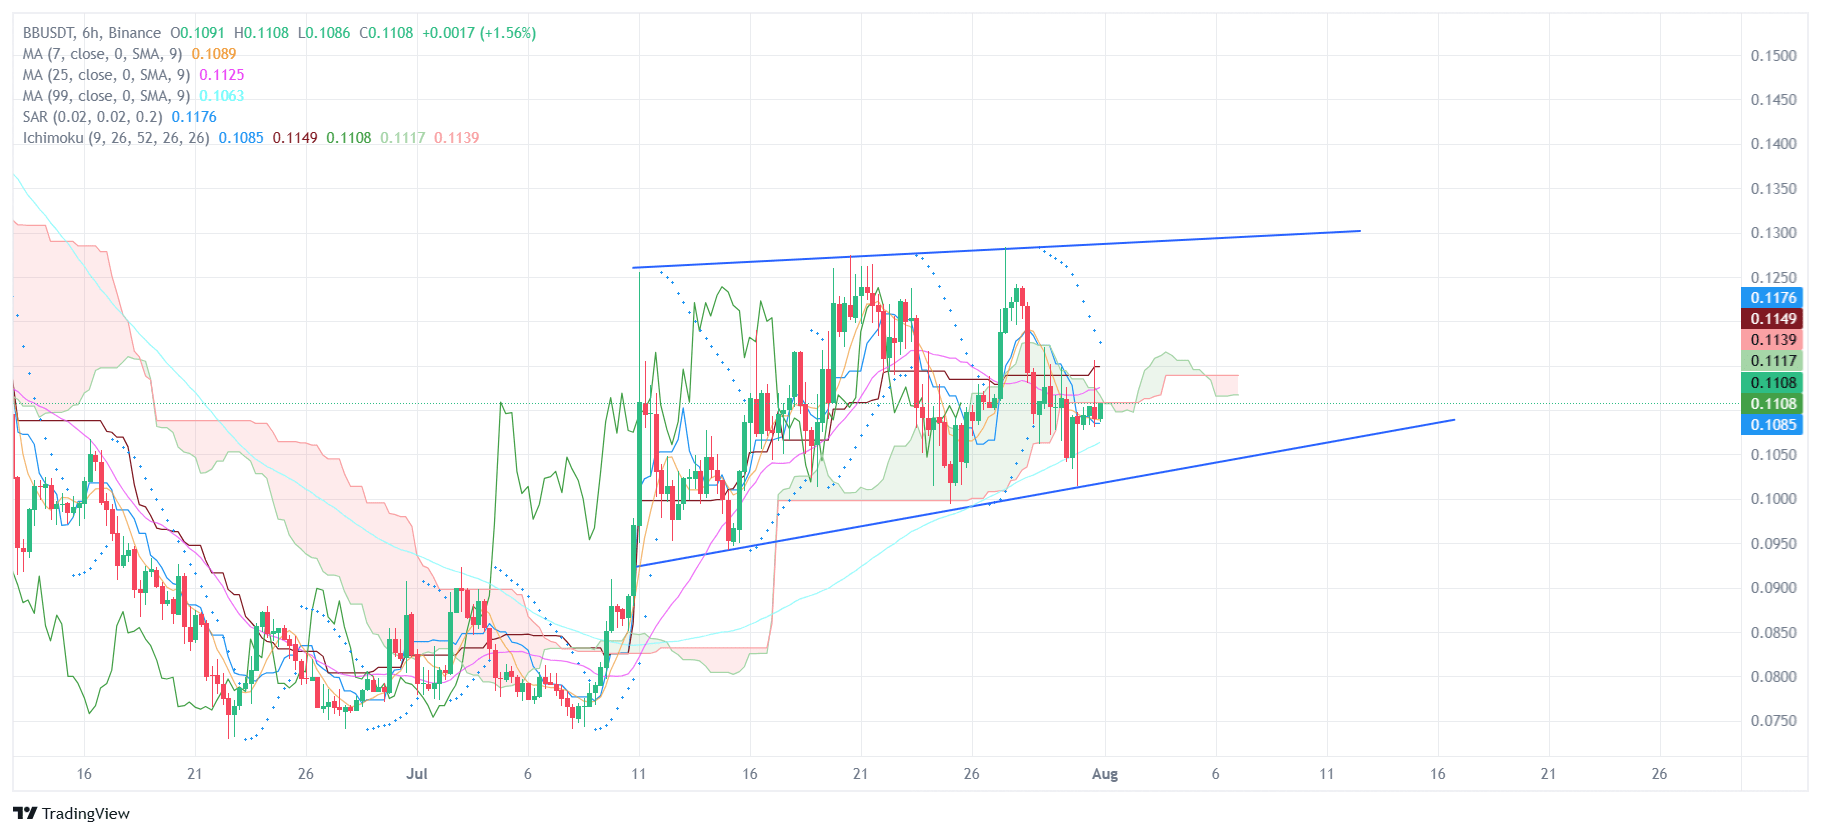
On the BBUSDT chart, we observe an ascending wedge formed since mid-July. The asset is trading in a structure where each minimum and maximum is gradually increasing, indicating an attempt by buyers to maintain the trend. However, this pattern could potentially be bullish or a warning of a correction.
📊 Key elements of the chart:
✅ Figure:
An ascending wedge is forming, where the price is working within channels with local peaks and rebounds. The upper boundary is around $0.125–$0.13, and the lower is near $0.105–$0.108.
✅ Indicators:
MA (7, 25, 99): All moving averages are in close interaction with the price, indicating consolidation. MA(99) acts as dynamic support.
Ichimoku Cloud: The price has entered the cloud — an area of uncertainty. A breakout upwards will give a bullish signal, while a downward breakout will strengthen the pressure.
Parabolic SAR: Points above the price, indicating a potential short-term correction.
📍 Levels:
Support: $0.1085 and the trendline from July 10
Resistance: $0.1139, $0.1176, and the upper boundary of the wedge ($0.125+)
🧭 Possible scenarios:
🔼 Bullish:
If the price breaks through the Ichimoku cloud upwards and consolidates above $0.1176, the path opens to test $0.125–$0.13. Confirmation of the movement will be an increase in volume and a breakout above the upper boundary of the wedge.
🔽 Bearish:
Breaking the lower boundary of the ascending wedge ($0.1085) will intensify the sell-off, targeting $0.105 and then $0.097–$0.100.
📝 Conclusion:
BBUSDT is in a consolidation phase with a bullish tilt, but the market is clearly waiting for a signal. The current structure is favorable for a cautious long, but the key trigger will be a breakout of the $0.1176 level. The asset is potentially ready for an impulse — we will monitor the breakout from the wedge and behavior in the Ichimoku cloud.

