

🔍 Technical Analysis of the ERA/USDT Asset (4H timeframe, Binance)
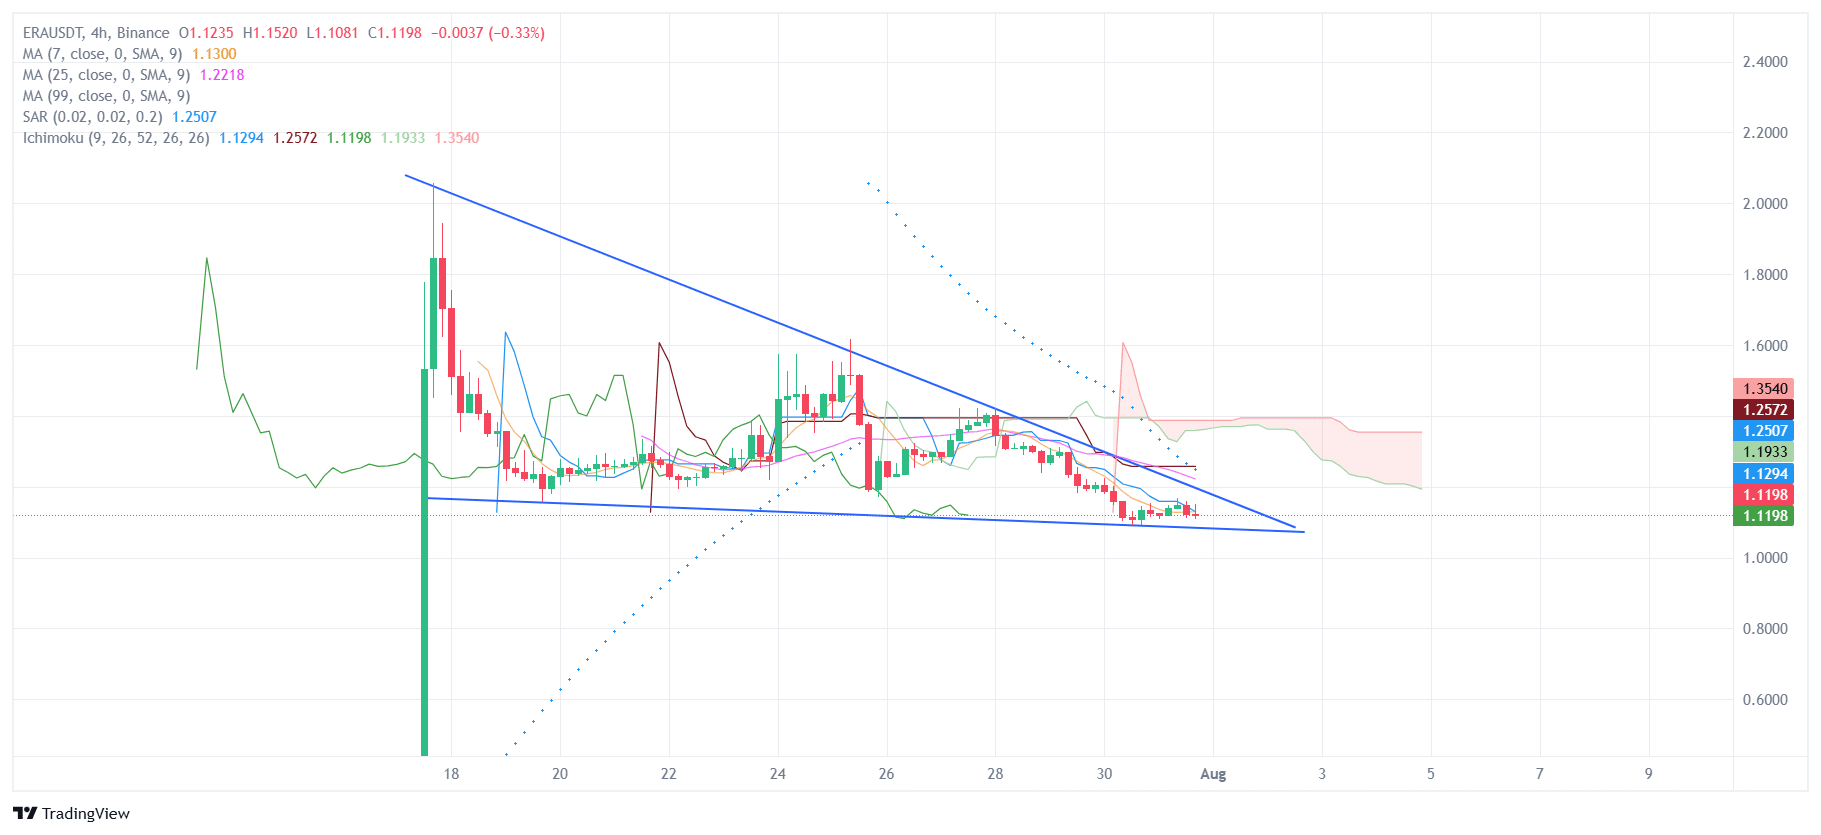
The chart shows a descending triangle formed since mid-July, with lower highs and a stable support zone around $1.11–$1.12. This pattern is often interpreted as bearish, especially if the breakout occurs downward.
📉 Key Observations:
✅ Trend:
The price is moving within a descending triangle, testing the support level near $1.12. Selling pressure is increasing, and if a downward breakout occurs, a further decline can be expected.
✅ Indicators:
MA(7), MA(25), MA(99) — all moving averages are positioned above the current price, confirming a bearish sentiment.
Parabolic SAR (points above the price) also indicates pressure from above.
Ichimoku Cloud — the price is below the cloud and also below the Tenkan and Kijun lines, signaling seller dominance.
✅ Key Levels:
Support: $1.11
Resistance: $1.22–$1.25
Breaking the support may lead to a decline into the $1.00 zone and below, if volume and trend are maintained.
📊 Possible Scenarios:
🔺 Bullish (less likely):
If the upper boundary of the triangle (~$1.18–$1.20) is broken on increased volume, a test of the $1.25–$1.30 zone can be expected, followed by $1.35.
🔻 Bearish (main scenario):
A breakout below $1.11 with consolidation will indicate a continuation of the decline. Potential targets: $1.00 and $0.90 as the nearest liquidity levels.
💡 Conclusion:
At the moment, the asset is in a zone of uncertainty, but with a clear bearish bias. The key trigger will be a breakout of one of the triangle boundaries. Considering the weakness of buyers and lack of momentum, a downward breakout seems more likely.
📌 Recommendation: watch for the breakout from the triangle and accompany the direction on the breakout with volume confirmation. $ERA

