People who play the cryptocurrency circle may see their money increase by 50 times or 100 times overnight, or they may lose everything in an instant.
Playing with contracts in the cryptocurrency world is thrilling and even more exciting than riding a roller coaster.
Have you ever experienced continuous losses and frequent margin calls?
Then you feel depressed and regret your decision?
Are you desperate to make a comeback, but you end up getting deeper into trouble?
You imagine the scene of success again and again, but reality slaps you in the face again and again?
This is something that every trader has experienced, and you and I are no exception!
The difference is that some people gave up in such torture, some lost all their capital, and very few persisted. But what is the point of persistence without complete enlightenment?
I've read countless tutorials, read many traders' summaries, and analyzed countless reasons for failure! I've summarized the following points, which I believe will be helpful to you:
1. Mental and emotional management
Managing your mentality and emotions does not mean that you cannot be happy when you make a profit, or cannot be depressed when you lose money, and become a robot without emotions!
Instead, it requires you to first firmly believe in your heart that you will succeed, believe that the current losses are only temporary, and truly develop a positive belief system. Secondly, when losses occur, you can remain rational and calm, not place orders blindly, and be able to analyze correctly and operate rationally. This is crucial!
2. Continuously improving the trading system
Remember, trading is not gambling, but it does have probabilistic attributes. You must constantly summarize and explore a trading system that suits you in long-term trading. Specifically, you should establish your own trading rules in various dimensions such as indicator analysis, positions, take-profit and stop-loss, long and short cycles to restrain yourself and determine your own transactions instead of being blind, otherwise you will be in an endless loop!
3. Fund Management
There's a saying that goes, "As long as there are green mountains, there's always firewood to burn." You must never have a "all-in" mentality; it's extremely dangerous. Once you have this thought, the market will most likely do the opposite, forcing you to give up hope completely! You must strictly control this. By calculating your losses under your maximum consecutive losses, you can manage your funds and ensure a chance of a comeback. This requires extreme calmness. Only when you have chips can you have a chance of rebirth!
4. Technical Analysis
This is incredibly important. If you don't have any technical skills, then you absolutely shouldn't place an order. You're gambling on luck, and you're bound to fail, which is terrifying! Learning technical indicators is a gradual process, but once you over-rely on them, you can become overwhelmed, make frequent mistakes, and then doubt your technique. Finding the right indicators for you among so many is crucial. Simplifying the complex is crucial. Commonly used indicators include naked candlestick patterns, Bollinger Bands, moving averages, MACD, volume bars, and OBV, to understand the essence of simplicity.
Long story short
Perpetual contracts, also known as perpetual futures contracts or perpetual futures, are a type of derivatives trading method. Users can use perpetual contracts to go long, short, and arbitrage to obtain trading investment returns that are many times higher than the invested principal.
Through perpetual contracts, you can not only make money from the rise in currency prices, but also from the fall in currency prices. You can also use leverage to use a small amount of capital to leverage large profits.
When using perpetual contracts for trading, if you mispredict the price trend, you may face the risk of liquidation, loss of position, and loss of all investment capital.
Whether you are a novice investor or someone experienced in cryptocurrency trading, reading this article will give you a deeper understanding of perpetual contracts.
The principle of perpetual contracts
The underlying logic of perpetual contracts is to allow investors to borrow virtual currency and buy or sell virtual currency at a specific price at a specific point in the future.
For example, Xiaoyu has 100 USDT and believes the price of Bitcoin will rise from 100 to 200 tomorrow. Xiaoyu can borrow 900 USDT from the exchange, use this 1000 USDT to buy 10 Bitcoins, and then sell them tomorrow when the price reaches 200. After the sale, Xiaoyu will have 2000 USDT in his account. After paying back the 900 USDT to the exchange, Xiaoyu will have a profit of 1000 USDT from this transaction.
If Xiaoyu had only used his original 100U capital to trade, his profit would only be 100 USDT. So in this example, Xiaoyu used 10x leverage and earned 10x profit by going long on Bitcoin.
However, if Xiaoyu mispredicts the price direction and the Bitcoin price drops to 50 the next day, then Xiaoyu's 10 BTC will only be worth 500 USDT, resulting in a nominal loss of 500 USDT. Therefore, using leverage in perpetual contract trading can amplify both gains and losses.
Why is it called a "contract"?
Cryptocurrency contract trading is a derivative of traditional commodity futures trading. In traditional futures trading, traders actually sign a contract when going long or short on a particular commodity's future price, which is why it's called a "contract" trading.
For example, if McDonald's predicts that potato prices will rise sharply in June next year, in order to control costs, McDonald's will sign a potato futures contract for June next year through the exchange. Regardless of the potato price at that time, McDonald's will purchase a batch of potatoes at the agreed price.
This way, regardless of potato price fluctuations, McDonald's can purchase potatoes at a stable price, ensuring a steady supply of French fries. If market prices rise, McDonald's can still purchase at the contract price, saving costs. Conversely, if market prices fall, McDonald's will still have to pay the contract price, but its total costs will be lower. In fact, international companies like McDonald's do use futures contracts to ensure supply stability and cost control.
However, when these commodity futures contracts are derived into virtual currency transactions, although the exchange borrows the operation mode of futures contracts, it will not actually lend you money or currency. Instead, it uses similar calculation methods to intuitively tell you the leverage ratio, expected profit or loss, lowering the threshold for contract trading and making it more convenient for more investors to use it.
What are the types of contracts?
Perpetual Contract: Perpetual contracts have no expiration date. Users can hold them indefinitely and close their positions on their own.
Delivery contracts: Delivery contracts have specific delivery dates, including weekly, bi-weekly, quarterly, and bi-quarterly delivery contracts. When the specific delivery date arrives, the system will automatically deliver regardless of profit or loss.
USDT-margined contracts: This means you need to use the stablecoin USDT as collateral. As long as you have USDT in your account, you can trade contracts in multiple currencies, and profits and losses are settled in USDT.
Currency-based margin contracts: use the underlying currency as collateral. You must hold the corresponding currency before trading, and profits and losses are settled in that currency.
The most stable way to play cryptocurrency contracts
Choose the right coin and be a good person. As a leveraged trader, volatility can be amplified by leverage. The primary consideration during trading is not volatility but certainty.
Go long on the strongest currencies in an uptrend, and go short on the weakest currencies in a downtrend.
For example, at the beginning of a new quarter, EOS and ETH had the strongest growth. These two currencies were the first choice for long positions when the market fell back, and Bitcoin was the first choice for short positions when the market fell. Even if the final result was that the mainstream currencies fell more than Bitcoin, only shorting or chasing Bitcoin can greatly avoid the risk of violent pullbacks.
Most of the traders in the cryptocurrency circle are short-term traders. When trading, it is difficult for them to have the opportunity to hold on to the ideal point to close the position. At the same time, they are not very proficient in position control, and they cannot rely on fluctuations to do T to pull the average price. Based on this situation, for most traders, a good opening price is more important than anything else.
Once you make a profit, sell some of it first to lock in the profit, and set a stop-loss at the cost price for the remaining part. This is also what I have always emphasized in my own community.
The Essence of Contract Trading Strategies
(1) Find the main trend and enter the market according to the main trend, otherwise do not enter the market.
(2) If you are trading with the trend, the entry point is:
1. A new breaking point in the trend;
2. The sideways trend moves towards a breakthrough point in a certain direction;
3. The pullback point of an upward trend or the rebound point of a downward trend.
(3) Positions that follow the trend will bring you huge profits, so never get out of the market early;
(4) If your position building is in line with the general trend and the book profit has proven that you are right, you can use the pyramid technique to increase your position; (Reference 2)
(5) Keep your position unchanged until the trend reverses and you close the position.
(6) If the market trend is opposite to the position you established, stop loss and run away.
In addition to adhering to the above strategies, you must also remember three qualities: discipline, discipline, and discipline!
The way to trade is to accumulate small gains into large ones, and compound interest is king. If you break even with your investment, you must not let it turn into a loss again. If you make a profit, you must pocket some of it to avoid wasting your time. In a nutshell: if you make a profit, go ahead and sell it; if you make a profit, you will lose the original price.
Tips for making money with perpetual contracts
1. Avoid full warehouse operation
How should funds be allocated? Fund allocation should be understood from two perspectives:
First, understanding capital allocation from a risk perspective begins with determining the maximum amount of loss your account can or is prepared to withstand. This forms the foundation for your capital allocation. Once this total is determined, consider how many times, if we experience consecutive losses, we should be willing to accept defeat.
Personally, I believe that even the riskiest strategy should be split into three attempts. In other words, you should give yourself at least three chances. For example, if your account balance is 200,000 yuan, and your client allows you to lose a maximum of 20%, or 40,000 yuan, then your riskiest strategy is: 10,000 yuan the first time, 10,000 yuan the second time, and 20,000 yuan the third time. I believe this strategy is reasonable. If you get it right once out of three times, you can profit, or even survive in the market. Avoiding being eliminated by the market itself is a success, a chance to win.
2. Grasp the overall market trend
It is much more difficult to follow a trend than to follow a fluctuation, because the trend is to chase the rise and kill the fall, and you need to have the determination to hold the position, and buying high and selling low is in line with human nature.
The more a transaction conforms to human nature, the less money you make. It is precisely because it is difficult that you can make money.
In an upward trend, you should choose to go long on any violent pullback. Remember what I said about probability? So, if you are not on the bus or have gotten off, wait patiently. If there is a drop of 10-20%, go long boldly.
3. Specify stop-loss and take-profit targets
Stop-loss and take-profit are the keys to profitability. Across several trades, we need to ensure that our total profit is greater than our total loss. This isn't difficult to achieve; simply follow these steps:
① Each stop loss is ≤ 5% of the total funds;
② Each profit is greater than 5% of the total capital;
③ Total transaction winning rate > 50%
Profit is achieved if the above requirements are met (a profit-loss ratio greater than 1 and a win rate greater than 50%). Of course, you can also achieve a higher profit-loss ratio and a lower win rate, or a lower profit-loss ratio and a higher win rate. In any case, as long as the total profit is positive, it is sufficient. Total profit = initial stake × (average profit × win rate - average loss × loss rate).
4. Beware of excessive trading
Because BTC perpetual contracts trade 24/7, many novices trade daily, even hoping to trade every day of the 22 trading days in a month. As the saying goes, "If you walk by the river often, you'll get your feet wet." Frequent trading leads to mistakes, which in turn can sour your mindset. Once your mindset sours, you may act impulsively, opting for "retaliatory" moves: perhaps going against the trend or increasing your holdings. This can lead to further mistakes, easily resulting in significant losses on paper, which can take years to recover.
5. Contract entry timing
Many users open orders 24/7, which is practically the same as giving away money. The purpose of contracts is to develop a stable profit strategy within controllable risks and relatively stable indicators, not to click buy and get rich quick! Therefore, the timing of entering a contract is extremely important!
⑴: Do not open orders during periods of significant good or bad news, because the market is very chaotic at this time, and the spot price can fluctuate rapidly between 1-3%. If you choose to gamble on the market at this time, you will easily be carried away by the Tiandizhen.
(2) I generally enter the market after a significant fluctuation, after the second bottom or rise, because after the second wave, the market volatility gradually stabilizes. The risk factor in the subsequent period is the lowest. The purpose of contracts is to implement the most appropriate strategy within the minimum risk range.
(3) Enter the market within the indicator range. Never place a trade if the indicator parameters do not meet your expectations. This means entering the market within your strategy and ignoring market trends until they reach your target price. Because leverage increases with contracts, risk also increases, so self-discipline is crucial.
To sum up, when the market stabilizes and the indicators are in place, the risk rate will be reduced by 50% before you can place an order.
Perpetual Futures Cons and Risks
Risk of liquidation
Liquidation means that when the loss of a position reaches a certain level and the margin is insufficient to support the position, the exchange will automatically force liquidation to protect the interests of the exchange and other traders.
As we mentioned earlier, the underlying logic of contract trading is actually leveraged lending. For example, Xiaoyu has an investment capital of 100 USDT and uses 10x leverage to open a long position in BTC worth 1,000 USDT. If the Bitcoin price is 100 USDT at this time, then the essence of this order is to borrow 900 USDT and purchase 10 BTC together with the principal, hoping to sell them for a profit after the Bitcoin price rises.
But if the price of Bitcoin plummets to 90 USDT per coin, Xiaoyu's 10 BTC would be worth only 900 USDT, exactly the amount he borrowed. If the price continues to fall, the value of these 10 BTC would drop below the amount he borrowed. The exchange, determined not to let itself lose money, would liquidate Xiaoyu's position if the Bitcoin price dropped 10%, to 90 USDT per coin. This is known as a "margin call."
After a margin call, not only do users not earn any money, they also lose the margin (principal) they used to open the position. Furthermore, the higher the leverage used, the more likely a margin call is to occur. In the above example, with 10x leverage, a 10% price fluctuation in the opposite direction would result in a margin call. With 100x leverage, a 1% price fluctuation in the opposite direction would result in a margin call.
The above example is based on a 100% loss before liquidation. However, in actual trading, each exchange calculates the liquidation loss percentage differently, and some may calculate it as 90%. Therefore, in actual trading, it is more accurate to directly refer to the forced liquidation price given by the exchange.
Pin risk
A market crash occurs when the market experiences a sudden and dramatic fluctuation followed by a rapid return to normal. This can trigger stop-loss orders or cause margin calls, leading to investor losses. A crash can be caused by insufficient liquidity on an exchange or by malicious market manipulation.
Funding rate wear and tear
As mentioned earlier, exchanges now require users holding perpetual contract positions to pay a funding fee every 8 hours. Although it is only 0.000x%, if the position is large and held for a long time, the cumulative amount of each funding fee can become a significant expense.
The contract is risky, please be cautious when trading!
Combined with the MACD indicator, the winning rate can reach 70%, avoiding margin calls!
To put it bluntly, playing in the cryptocurrency world is a battle between retail investors and market makers. If you don't have cutting-edge information and first-hand data, you will only be exploited! If you want to join in the layout and harvest the market makers together, you can come to (Official Account: Trend Prediction) and welcome like-minded cryptocurrency circles to discuss together~
Contract MACD practical tips:
1. MACD is above the zero axis. Every time a golden cross occurs, the price of the currency is about to reach a new high.
2. MACD is below the zero axis. Every time a death cross occurs, the price of the currency is about to hit a new low.
3. MACD forms a golden cross below the zero axis, which indicates a downward trend rebound. It will not participate until it reaches the zero axis.
4. MACD crosses above the zero axis, indicating an upward bullish trend. Buy low and sell high until the top diverges. If MACD is low, the price will rise, but the next wave of red bars will not be as high as the previous wave, indicating a decline.
6. If MACD is small, the price of the currency will fall or remain flat, and the next wave of green columns will not be as low as the previous one, which means it will rise.
7. MACD shrinks at a high level: After the currency price rises sharply, MACD moves away from the zero axis and the red column shortens, and moves away quickly.
8. MACD golden cross at a low level: After the currency price drops sharply, MACD moves away from the zero axis and is bound to rise. A second golden cross will increase the rise even more violently.
9. MACD golden pit: the currency price rises and then falls back. MACD dead crosses within 7 days, the green column is short and there is a golden cross, which means it is rising.
The MACD indicator plays a very special role in technical analysis and can be said to be an essential part of learning technical analysis. Its importance lies in at least the following points.
1. The MACD indicator is the most effective technical indicator that has been tested by historical trends and is also the most widely used indicator.
2. The MACD indicator is derived from the EMA indicator and is very effective in identifying market trends. Trend investors generally refer to this indicator in their actual trading.
3. The top and bottom divergence of the MACD indicator is the recognized and best-used method of "picking the bottom and selling the top". This method is an important tool for the concretization of trend theory and wave theory.
4. Many veteran traders have this experience: they start to learn the MACD indicator when they first get started, then gradually abandon it, and after a long period of study and comparison, especially after actual combat testing, they finally return to the MACD indicator. This shows the special features of this indicator.
5. The MACD indicator is also widely used in quantitative trading.
Because of these advantages, the MACD indicator has become the most commonly used technical indicator by professional traders.
The concept and algorithm of MACD indicator
The MACD indicator, or Moving Average Convergence Divergence, was created by Geral Apple as a technical analysis tool used to track price trends and identify buy and sell opportunities based on candlestick patterns. This indicator is commonly used in market analysis software and is known as the "King of Indicators," as shown in Figure 1.
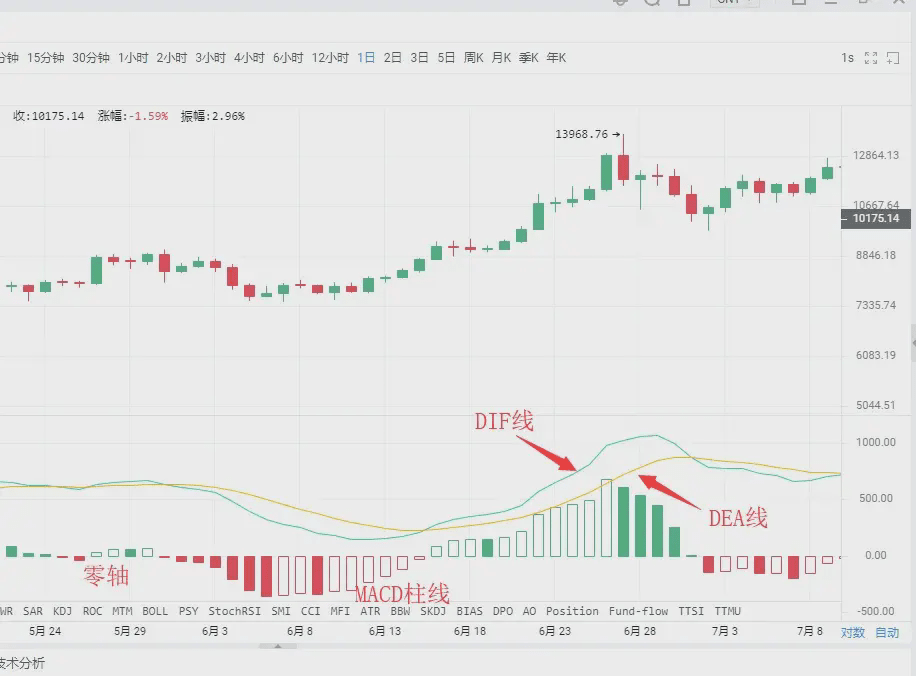
The cryptocurrency MACD indicator consists of three lines and one axis: the DIF fast line, the DEA slow line, the MACD histogram, and the zero axis. Investors use these three lines and one axis to analyze prices, using patterns such as crossovers, divergences, breakouts, and support and resistance patterns. The MACD indicator is a top choice in many market analysis software, demonstrating its widespread application and its status as one of the most effective and practical indicators tested by history.
MACD golden cross and death cross
The "Golden Cross" and "Death Cross" patterns are extremely important in technical indicator analysis. A Golden Cross, also known as a golden cross, occurs when a relatively short-term indicator line crosses upward and crosses over a relatively long-term indicator line (of the same type), often signaling a short-term buying opportunity. If a Golden Cross pattern appears after: 1. a short-term, rapid decline during a downtrend; 2. a pullback during an uptrend; or 3. a consolidation during an uptrend, that is, at a specific low point, it is a more reliable buy signal.
A death cross, also known as a death cross, occurs when a shorter-period indicator line crosses downward and crosses over a longer-period indicator line (of the same type). This often signals a short-term sell opportunity. If a death cross occurs after: 1. a period of consolidation during a decline; 2. a rebound during an uptrend; or 3. a short-term rapid rise during an uptrend, that is, at a specific high point, it is a more reliable sell signal.
After understanding the golden cross pattern and the death cross pattern, we can take a closer look at the golden cross pattern and the death cross pattern of the MACD indicator line. The golden cross and death cross appear in different positions and will reflect different market meanings.
Situation 1: Buying point of low golden cross
If the golden cross between the DIFF and DEA lines appears below and far from the zero axis, this is called a low-level golden cross. Investors can view this golden cross as merely a short-term price rebound. Whether the K-line can form a true reversal requires observation and confirmation in conjunction with other indicators.
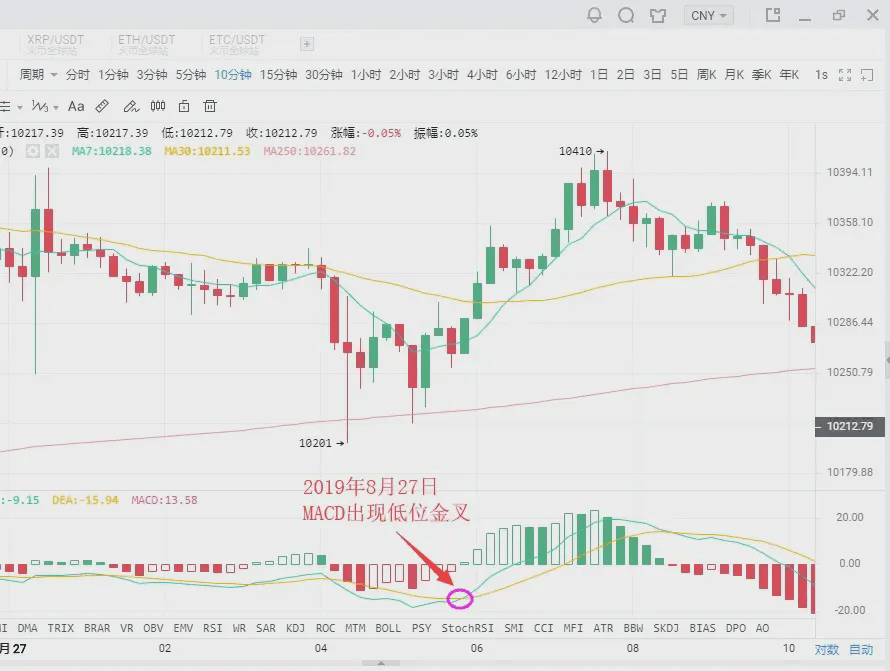
As shown in the figure above:
On August 27, 2019, the BTC 10-minute K-line chart showed a low-level golden cross as the price fell back, followed by a rebound of $200. Short-term investors can seize the opportunity to enter the market.
Case 2: Buying point of golden cross near zero axis
If an upward trend has been formed and the golden cross of the DIFF line and the DEA line occurs near the zero axis, then this is often an excellent time for investors to buy.
This is because, after the upward trend forms, a golden cross near the zero axis indicates that the correction has completely ended and a new round of upward trend has begun. At this time, if the golden cross of the moving average is also accompanied by the golden cross of the moving average, it means that the price increase is supported by trading volume, and the buy signal will be more reliable.
Once this buying point appears, investors should never miss it, otherwise they will miss the big rally.
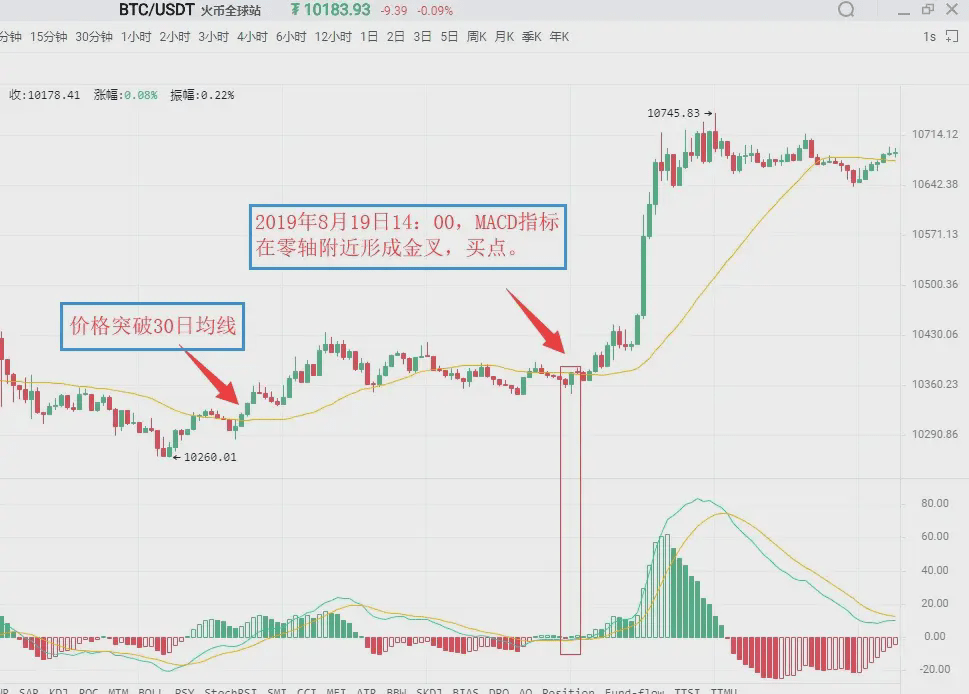
As shown in the figure above:
At 09:30 on August 19, 2019, the BTC 5-minute candlestick chart showed Bitcoin breaking through the 30-day moving average, indicating that an upward trend had initially formed. For a period of time thereafter, the price remained above the 30-day moving average.
At 2:00 PM on August 19, 2019, the MACD indicator formed a golden cross near the zero axis, indicating that the market is about to see a large upward trend. Investors can buy decisively.
Situation 3: Buying point of high golden cross
If the golden cross of the DIFF and DEA lines occurs above the zero axis and at a relatively high distance from it, it is called a high-level golden cross. A high-level golden cross typically occurs during a consolidation trend following an upward movement of the K-line, signaling the end of the consolidation and the imminent resumption of the previous upward trend. Therefore, the appearance of a high-level golden cross is a good signal to increase your position.
In actual practice, when an upward trend is formed and the K-line rises slowly and lasts for a long period of time, once the MACD indicator forms a golden cross at a high level, it is often a sign that the K-line is about to accelerate its rise.
Because of this, high-level golden crosses can also be used for swing trading. Investors can use the MACD indicator to continuously snipe the rising band in the upward trend.
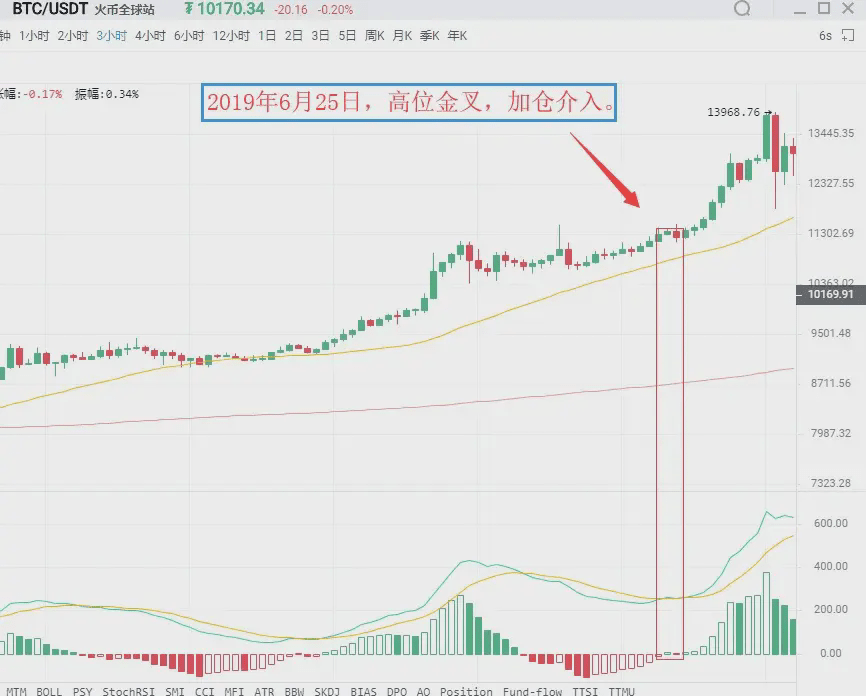
As shown in the figure above:
On June 25, 2019, the BTC 3-hour candlestick chart showed Bitcoin prices rising again after a period of consolidation. Meanwhile, the MACD indicator formed a golden cross at a high level. This indicates that the correction has ended and the price will resume its previous upward trend. Investors should seize this opportunity to increase their positions.
Case 4: Selling point of low-level death cross
A low-level death cross occurs far below the zero axis. This type of cross often occurs at the end of a rebound in a downtrend, and is therefore a sell signal. At this point, investors without a clear market view should wait and see. Those who are still holding positions and are deeply trapped can sell and then buy back in after the price drops to reduce their costs.
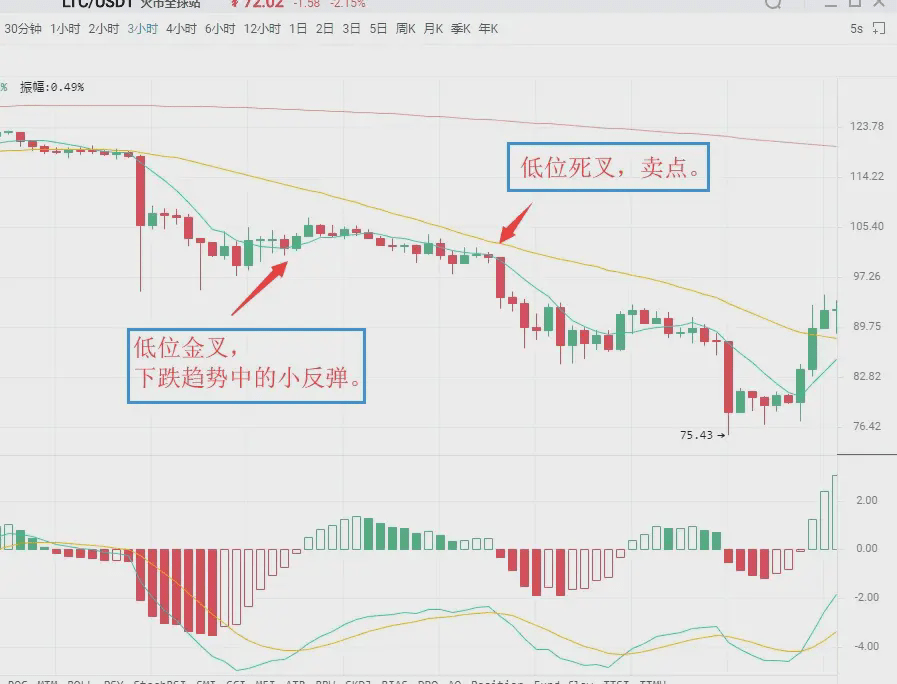
As shown in the figure above:
On July 14, 2019, the LTC 3-hour K-line chart showed that the MACD indicator of Litecoin had a low golden cross, and the price rebounded slightly, and then quickly fell.
Then, the MACD indicator forms a death cross below the zero axis, and the K-line begins a new round of decline. Spot investors can sell positions at the death cross position and cover them later to reduce the cost of holding positions.
Situation 5: Selling point of death cross near zero axis
If the previous market direction has been a downward trend, the cross formed when the DIFF line falls below the DEA line near the zero axis is called a death cross near the zero axis. It shows that the market has accumulated a lot of downward momentum near the zero axis. The appearance of a death cross indicates that the market's downward momentum has begun to be released, and the K-line will continue the original downward trend, which is a sell signal.
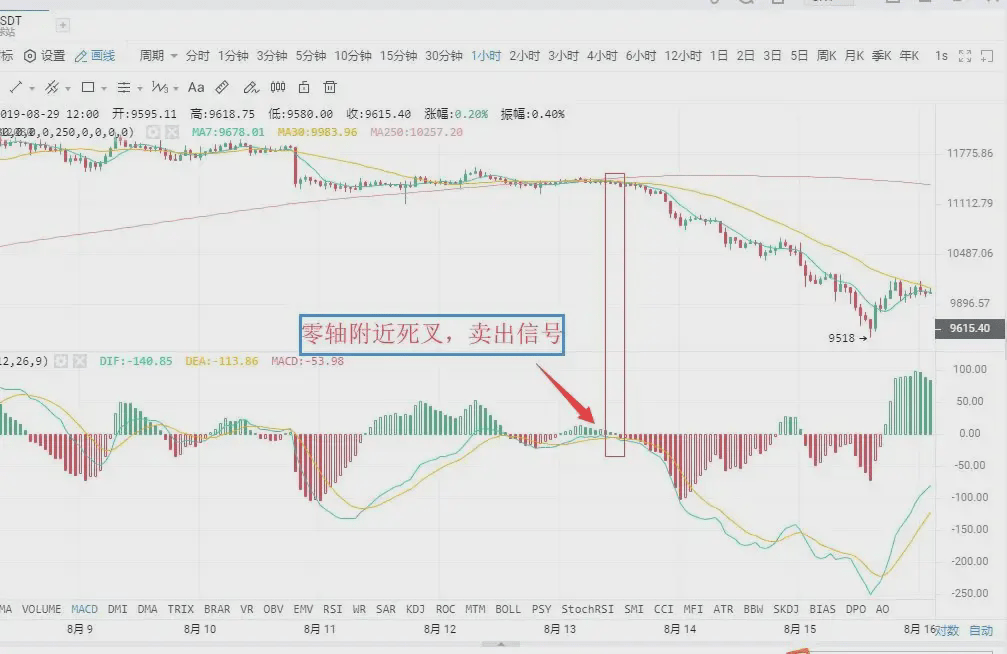
As shown in the figure above:
On August 12, 2019, the 1-hour BTC candlestick chart showed Bitcoin's DIFF line falling below the DEA line near the zero axis, forming a death cross. This indicates that the market is beginning to release downward momentum, a sell signal. Investors should decisively sell their positions to avoid being deeply trapped.
Situation 6: Selling point of high-level death cross
When the DIFF line breaks below the DEA line well above the zero axis, the crossover is called a high-level death cross. This type of death cross is sometimes accompanied by a MACD top divergence. This manifests itself as: while the price continues to rise and hit new highs, the MACD indicator's DIF and DEA lines no longer rise or continue to rise, but instead diverge from the price trend, moving downwards.
Above the zero axis, the DIF line crosses the DEA line to form a downward cross trend pattern, which is a death cross and a relatively reliable sell signal.
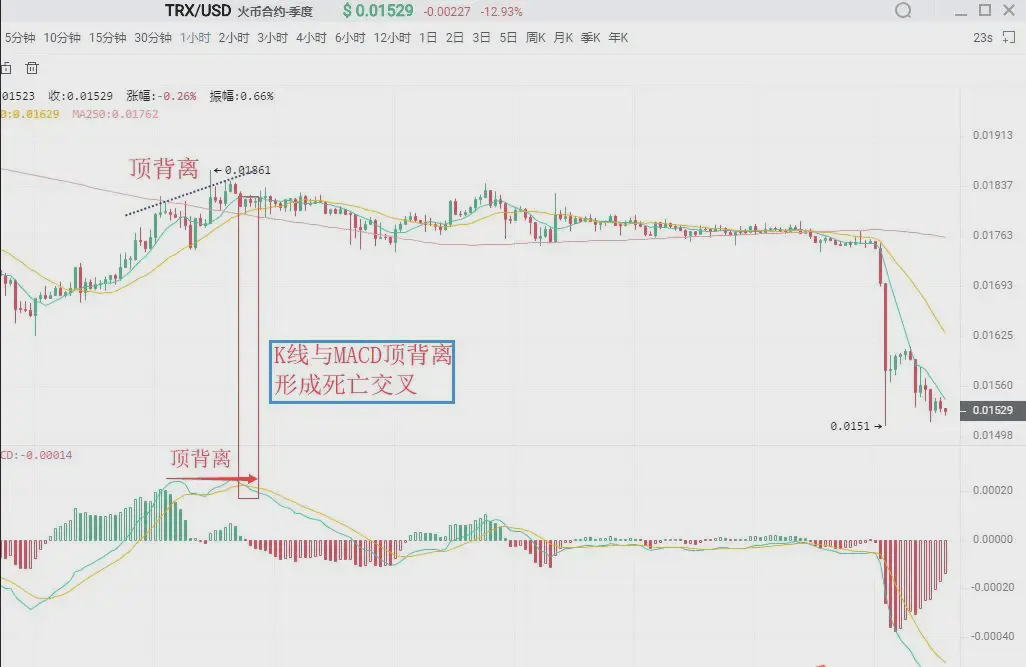
As shown in the figure above:
On August 23, 2019, TRX 1-hour K-line chart, after a wave of upward movement, the price of Tron continued to hit new highs, but the DIF line and DEA line stopped rising continuously, and then formed a death cross, a sell signal.
Divergence between MACD and K-line
Divergence is a term used in physics to describe momentum. In technical analysis, it's a highly successful and widely used analytical method. During a downtrend, when prices hit a new low but the indicator doesn't, this is called a bottom divergence. This indicates that upward momentum is building and is a buy signal. During an uptrend, when prices hit a new high but the indicator doesn't, this is called a top divergence. This indicates that downward momentum is building and is a sell signal.
Ⅰ. Bottom Divergence
(1) Divergence between MACD-Histogram and DIFF Line
A divergence between the DIFF line and the price occurs when, during a downtrend, the price hits a new low, but the DIFF line doesn't. This indicates that the DIFF line's decline is smaller than the price's, indicating that upward market momentum is building, and prices are about to stop falling, with a high probability of rising in the coming period.
The MACD-Histogram (MACD-Histogram), hidden behind the DIFF line, is a red and green MACD-Histogram line. Divergence between the MACD-Histogram and price is a key use of the MACD indicator and is widely used in real-world trading. A bottom divergence between the MACD-Histogram and price occurs when prices repeatedly hit new lows, but the MACD-Histogram fails to follow suit. This indicates that upward market momentum is building, and prices are about to stop falling, with a high probability of further increases.
When a bottom divergence occurs, investors can grasp the specific buying point in two ways.
(2) Specific timing for buying players
The bottom divergence between the DIFF line, MACD-bar chart, and price isn't a specific moment in time, but rather a pattern that occurs over a period of time. However, when investors buy, it's a specific moment, indicating that prices are about to stop falling. Therefore, to identify the right time to buy, when the DIFF line, MACD-bar chart, and K-line chart show bottom divergence, investors must combine bottom divergence with other technical analysis tools to identify specific buying points.
First: Bar color change or MACD golden cross
A color change in the bar indicates that upward market momentum is gaining momentum. This generally occurs after a shortening of the bar, though it is more reliable. When a bottom divergence occurs and the bar changes color smoothly or forms a golden cross, investors can buy.
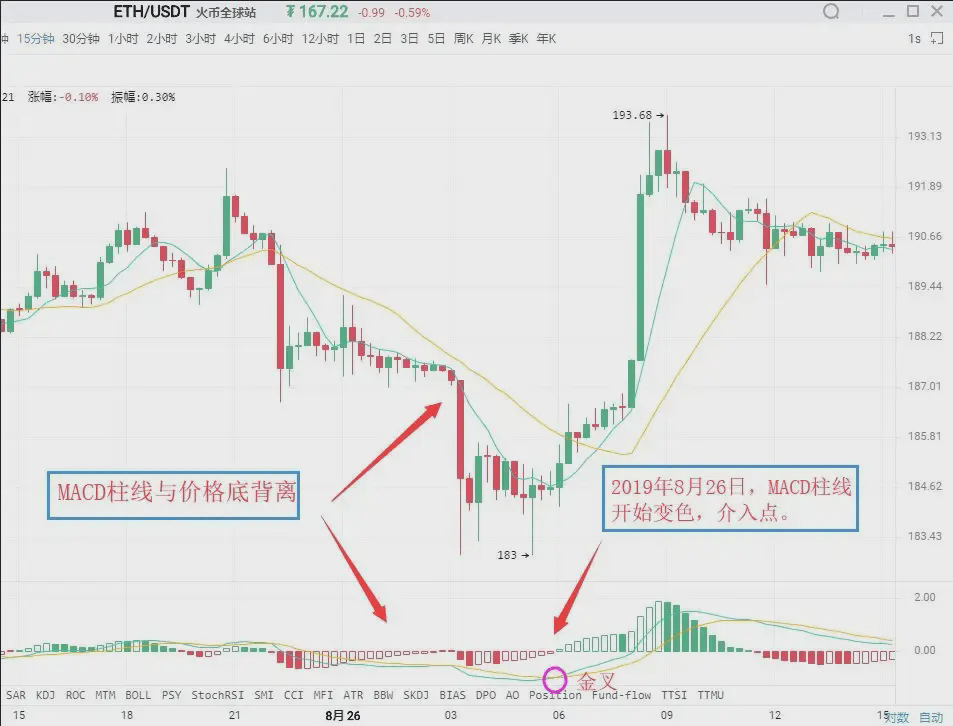
As shown in the figure above:
On August 26, 2019, the 15-minute candlestick chart of Ethereum (ETH) showed that while the price of ETH was falling, it hit a new low. However, the MACD-Histogram did not, forming a bottoming divergence between the histogram and the price. This indicates that upward momentum is beginning to accumulate in the market, and there is a high possibility of a subsequent upward trend in the price.
Then the bar changes color. The two buy signals appearing one after another are superimposed on each other, which increases the reliability of the rising significance. Investors can intervene when the bar changes color.
Second: Combine with other technical analysis tools and K-line reversal patterns
The combination of bottom divergence and K-line reversal pattern, such as "single needle bottoming" and "three red soldiers at the bottom", is the specific application of the "multi-indicator coordination" principle.
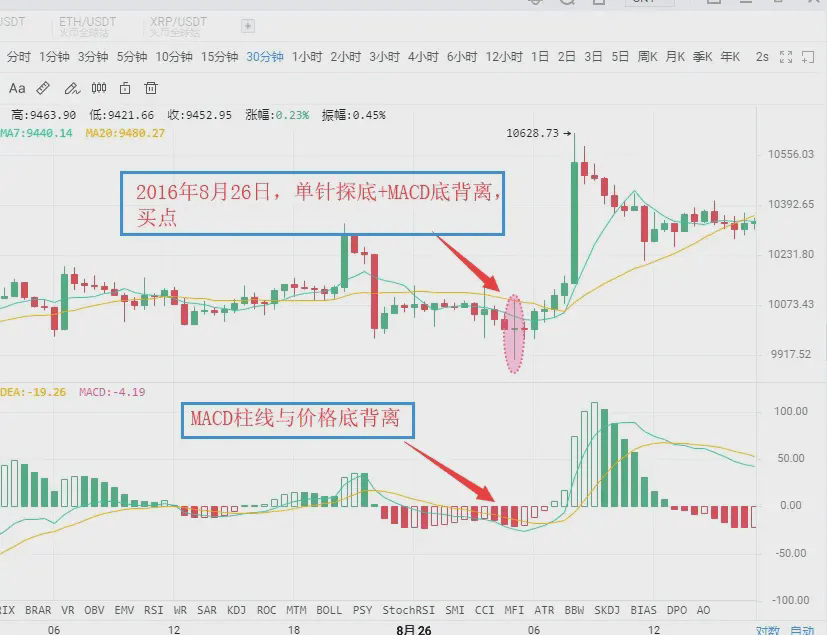
As shown in the figure above:
On August 26, 2016, the BTC 30-minute candlestick chart showed that the price of Bitcoin hit a new low, but the MACD bar line did not hit a new low, forming a bottom divergence pattern between the bar line and the price, indicating that the market's upward momentum continued to increase.
As the price stopped falling, a buy signal of "MACD bar line divergence from price bottom + K line single needle bottoming" was formed. After that, the price showed a wave of upward trend.
Ⅱ. Top Divergence
(1) Divergence between MACD bar and DIFF line
A divergence between the MACD-Histogram and the K-line occurs when, during an upward trend, the price hits a new high, but the MACD-Histogram fails to do so. This indicates that downward momentum is building in the market, and prices could fall at any time.
A divergence between the DIFF line and the K-line occurs when, during an uptrend, the price hits a new high, but the DIFF line fails to reach a new high. This indicates that downward momentum is building in the market, and that a downward trend is likely to occur in the price.
(2) Specific selling timing
Similar to bottom divergence, in actual operation, based on the principle of multi-indicator coordination, investors can combine the following methods to make the sell signal more specific.
First: Bar color change or MACD death cross
After a MACD-Histogram diverges from the K-line, if the bar suddenly shortens significantly, it indicates that the market is beginning to release downward momentum. Investors should be careful to sell immediately. A change in the MACD-Histogram indicates that the market's downward momentum has taken hold, which usually occurs after the bar continues to shrink. If the bar changes color or a MACD death cross occurs after a top divergence from the K-line, investors should be careful to exit the market immediately.
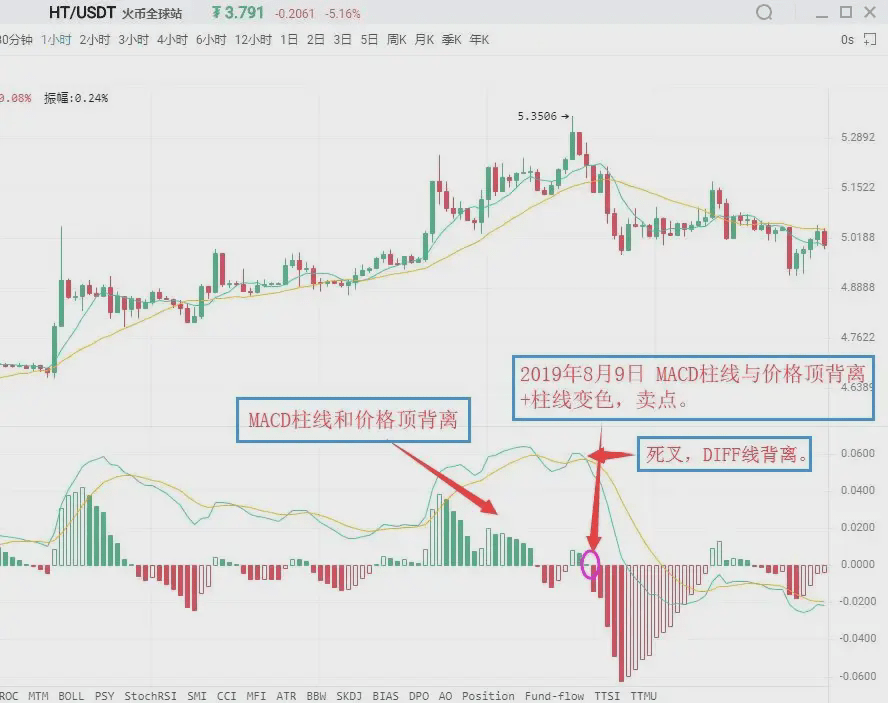
As shown in the figure above:
On August 9, 2019, the HT 1-hour candlestick chart showed Huobi's price reaching a new high, but the MACD histogram failed to reach a new high, forming a top divergence between the histogram and the price. This indicates that downward momentum is beginning to accumulate in the market, and prices may fall at any time.
Subsequently, the MACD line turns from red to green, issuing a sell signal of "divergence between the line and the price top + color change of the line". Investors should pay attention to exiting the market in time.
Second: Combine with other technical analysis tools and K-line reversal patterns
When MACD-bars diverge from prices, if other technical analysis tools also generate sell signals, the reliability of the market's sell signal increases significantly. Investors should be cautious about exiting the market immediately. Common examples of such sell signals include "a divergence between MACD-bars and prices combined with a K-line reversal pattern."
As shown in the figure above:
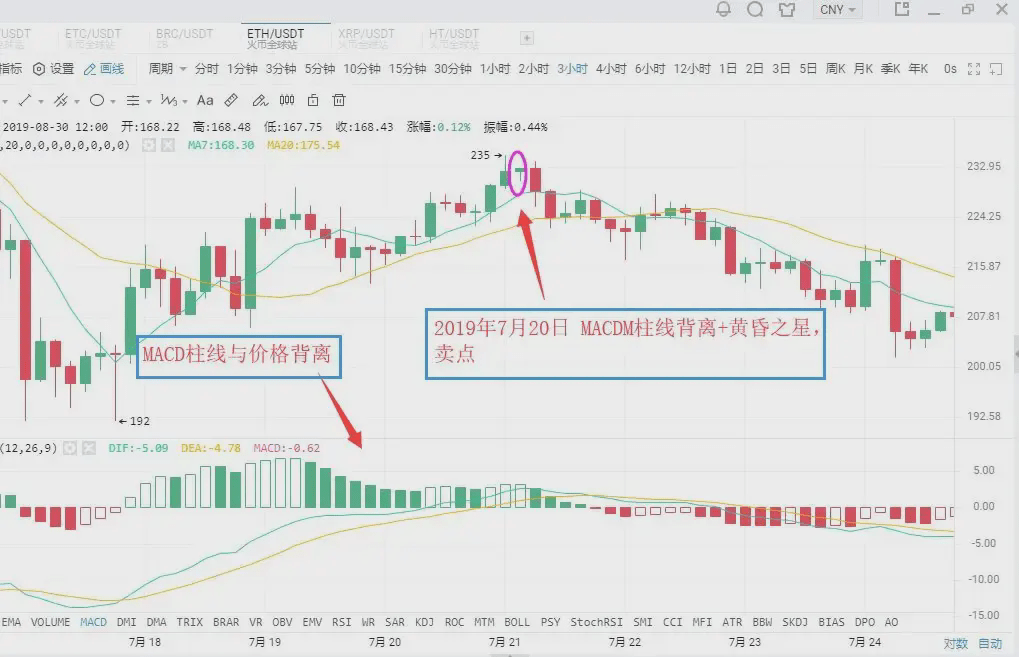
On July 20, 2019, the ETH 3-hour candlestick chart showed Ethereum prices hitting a new high, but the MACD bar chart did not, forming a top divergence between the bar chart and the price. This indicates that the market's downward momentum is increasing and the price may experience a wave of downward movement.
Subsequently, the MACD histogram gradually shortened, and the K-line formed a bearish evening star pattern. Investors should pay attention to exiting the market in time, and then the K-line showed a large downward trend.
Appendix:
Evening Star: During an upward candlestick pattern, a long bullish candlestick appears first, followed by a shorter candlestick (either bullish or bearish) the next day. This is often compared to a star, representing the core of the candlestick pattern. The third candlestick is a long bearish candlestick, extending deeper into the core of the first. The Evening Star signals a price peak and subsequent decline, with some predicting an accuracy rate exceeding 80%.
(Regarding some K-line patterns that indicate peaks and bottoms, we will have several dedicated courses to explain them in depth later. Please continue to pay attention.)
Modification of MACD parameters
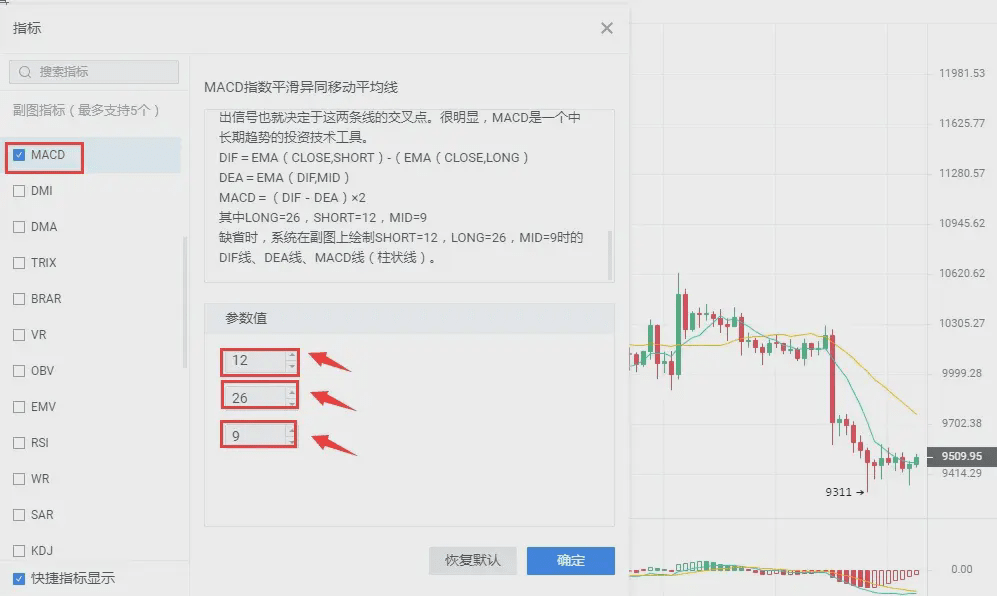
A drawback of the MACD indicator is that it reacts slowly to price changes, sometimes resulting in less-than-ideal buy and sell prices. One way to improve this is to change the indicator parameters to make it more responsive to market trends, thereby achieving more ideal buy and sell prices.
In commonly used market software, the default parameters of the MACD indicator are 12/26/9. Under such parameter settings, the MACD indicator's response to price changes often has a significant lag.
The lag of the MACD indicator can be addressed by adjusting its parameters. Common parameter combinations include 5/34/5, 5/10/30, etc. Investors can also experiment and explore more in practice.
Execution is the key flaw in trading, and holding onto positions is a common problem in investing. Without good execution, even the best strategies can't be realized. However, with excessive holding, even the smallest mistakes are magnified, multiplying like a disease. When you can no longer bear it and leave the market, I doubt anyone will say goodbye. Even if you were there, no one will remember you a year from now. Never rely on luck to hold onto a position, and never bet with a full position on any gamble. One misstep and you're done. Success is achieved only when you succeed a hundred times.
After much hard work, I have summarized 10 rules and experiences of cryptocurrency trading. Although there is not much content, it is very valuable. If you think it does not make sense after reading it, you can say whatever you want to me!
1. Never buy coins at high prices. You must have this mentality: it can grow as much as it wants, just treat the coin as if it doesn’t exist.
2. There are only two types of coins. Coins at the buying point are good coins, otherwise they are junk coins; coins at the large-scale buying point are the best blue-chip coins. Be patient and wait for the coins that have been built up at a large level to become real blue-chip stocks. This is the real mentality.
3. In fact, the most important thing when trading cryptocurrencies is your mindset. Many people know it’s not a good time to buy, but they can’t help but want to buy. This is a mindset issue. If you don’t solve this problem, any theory will be useless.
4. Maintain a steady mindset and don't get attached to any particular currency or price. Focus solely on market signals. You should have a strong sense of purpose for buying and selling points. If you have good skills and ample capital, such as the ability to trade on a 30-minute schedule, then you'll never be late.
5. The reason for mistakes has nothing to do with the market. When looking for reasons, you can only look for your own reasons. You must summarize any mistakes immediately.
6. The mentality of rushing to make money is a taboo for those of us who speculate in cryptocurrencies. If we can't even control our own hearts, our greed and desires, we won't be able to succeed in the market for a long time. When you hold cryptocurrencies, your thinking is controlled by the bulls, and vice versa, you are a slave to the bears. Market sentiment is thus accumulated and guided. Those who cannot escape this state will always be untrue market participants.
7. Cryptocurrency trading tests long-term profitability, not one-time gains. The key is an effective long-term trading strategy. Consider all scenarios when buying, be resolute in holding, and even more resolute in selling. This is the only way to gradually improve. You are the one trading cryptocurrencies, not the cryptocurrencies that are trading you. Start with yourself.
8. The cryptocurrency market rewards patience. Any good cryptocurrency needs to be nurtured. Those who exchange new coins daily will inevitably have small capital and make small investments. Focus on your investments; you won't make big money if you're constantly running around.
9. Dance to the rhythm of the market. As long as you follow the market's rhythm, you can walk on a knife's edge. Rhythm is always the market's rhythm. A market participant without a sense of rhythm will always be tortured. Set aside your greed and fear and listen to the rhythm of the market. As long as you can follow the rhythm, no one can stop you. The market has a rhythm. Grasp the current rhythm, and no one can defeat you.
10. When playing with capital, remember that the power of compound interest is the greatest. As long as you have a good mentality and skills, compound interest is inevitable, and this can overcome everything.