Visual Intelligence for Blockchain Transparency
Blockchain data is powerful — but also overwhelming.
That’s where BubbleMaps.io comes in. It transforms raw wallet and token data into beautiful, interactive visuals that reveal real connections, large holders, suspicious patterns, and token dynamics at a glance.
🔍 What Are Bubble Maps?
Bubble Maps let you visualize wallet interactions in the form of connected bubbles:
🟣 Each bubble = a wallet
🔗 Lines = token transfer links
🔁 Clustered bubbles = groups of interacting wallets
🎯 Larger bubbles = wallets holding more tokens
With a single glance, you can detect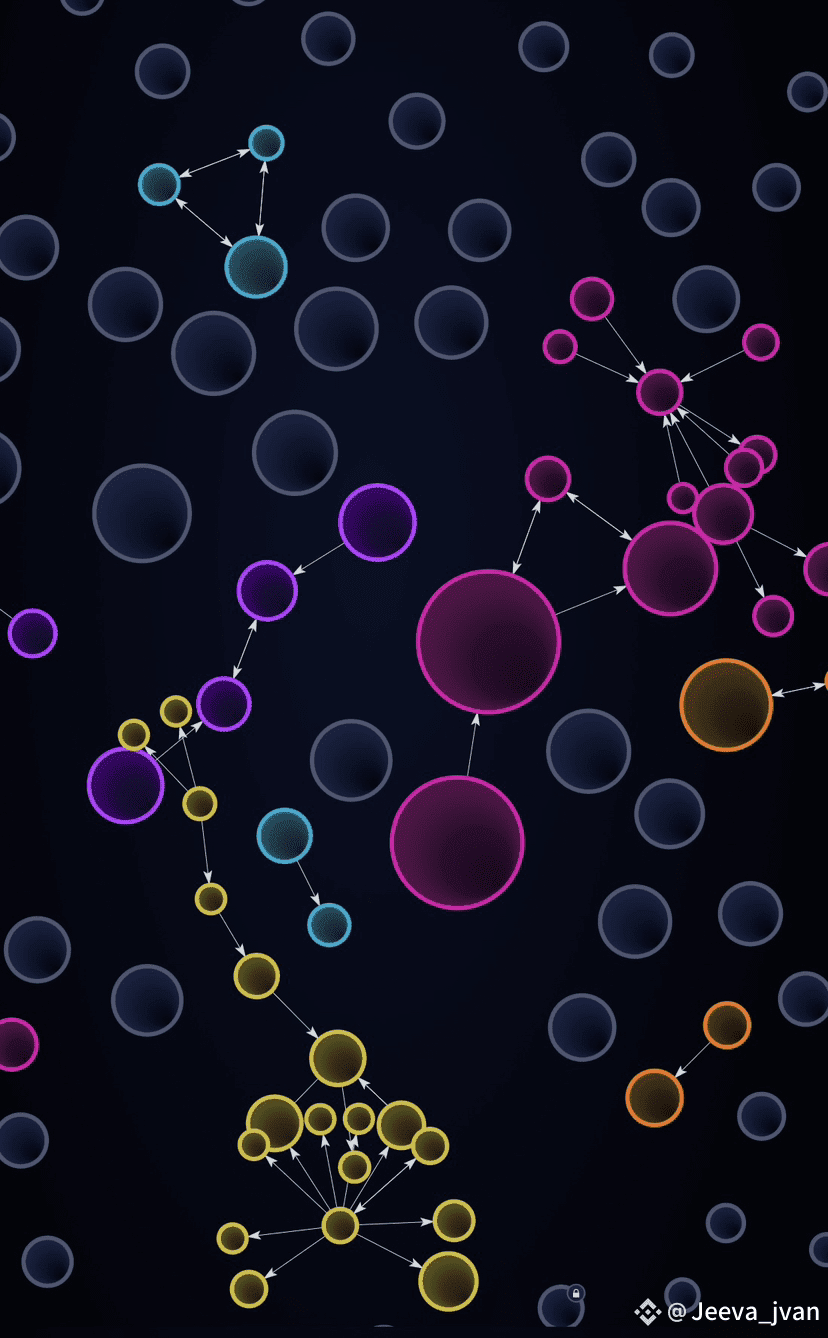
✅ Insider activity
✅ Whale clusters
✅ Liquidity movements
✅ Suspicious loops
✅ Token manipulation
🌐 Who Should Use It?
Traders: Identify risky token allocations or pump & dumps
Projects: Ensure token transparency and holder trust
Auditors: Gain visual evidence of wallet activity
Communities: Promote decentralized & fair tokenomics
🚀 Why It Matters #Bubblemaps
In the age of meme coins, airdrops, and copy-trading, wallet transparency = survival.
BubbleMaps gives you an edge in DYOR, making on-chain data easy to trust
🧠 Because the next 100x starts with knowing who’s holding the bag.
🔗 Try it now:
v2.bubblemaps.io @Bubblemaps.io