🧠 Introduction:
In the ICT methodology, identifying swing highs and lows, distinguishing between true and false breakouts, and detecting a market structure shift (MSS) are essential components for understanding price movements, market intent, and key entry/exit points.
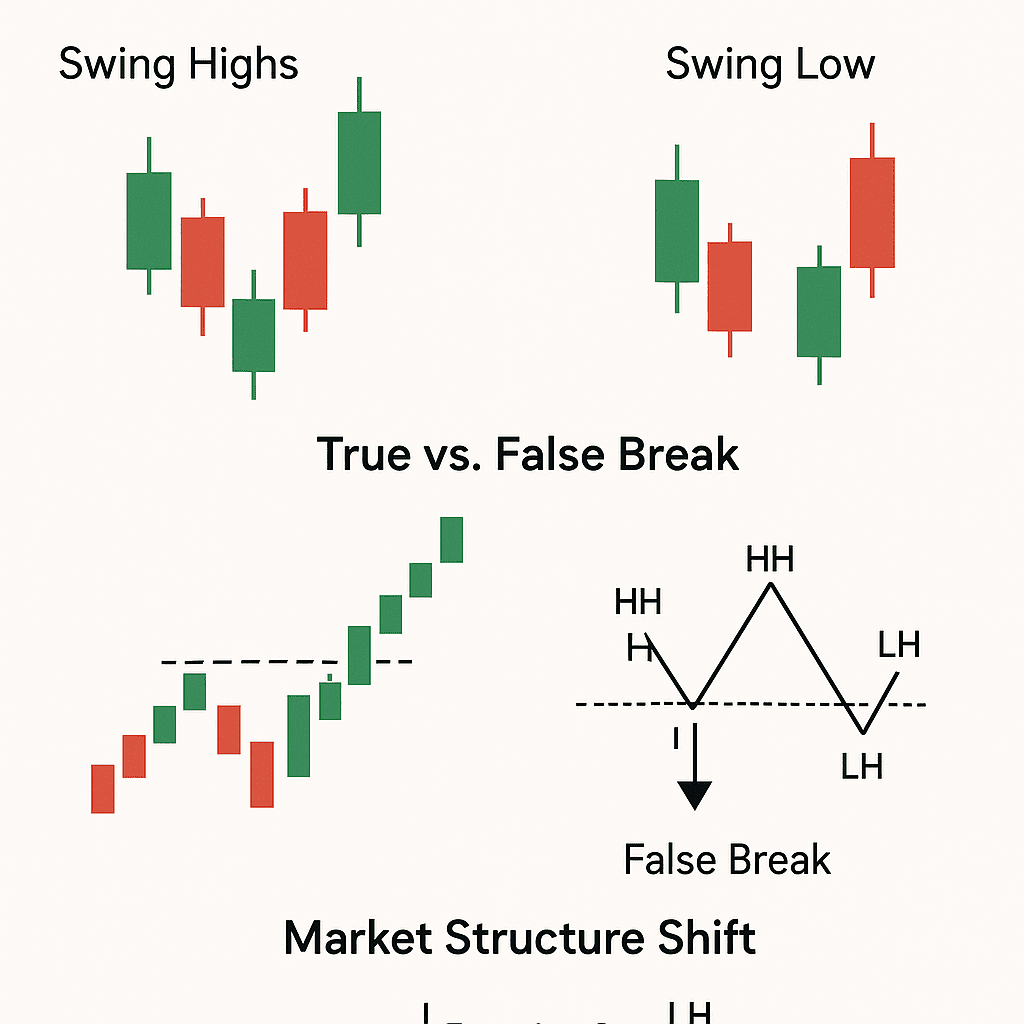
1. Swing Highs & Lows:
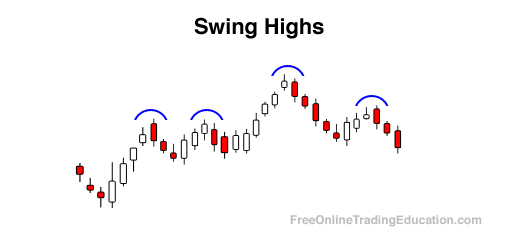
● What is a Swing High?:
A swing high is a candle whose high is higher than the highs of the candles immediately before and after it.
This is often a bearish candle or a bullish candle with a long upper wick, indicating temporary resistance or market rejection from higher prices.
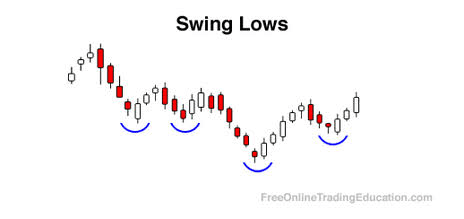
● What is a Swing Low?:
A swing low is a candle whose low is lower than the lows of the candles immediately before and after it.
It’s usually a bullish hammer or a bearish candle with a long lower wick, indicating support or potential reversal.
● Why they matter:
Help identify market direction.
Serve as key support and resistance levels.
Provide the foundation for reading market structure.
2. True vs. False Breakouts:
● True Breakout:
A true breakout happens when a key swing high or low is broken with a strong confirming candle.
Typical candles that signal a true breakout:
Bullish or Bearish Marubozu: No wicks, full-body candle – shows strong control.
Engulfing candle: Completely engulfs the previous candle’s body – confirms momentum.
Example:
If a bearish Marubozu candle breaks below a major swing low and closes strongly below it, this signals a true breakout and likely continuation.
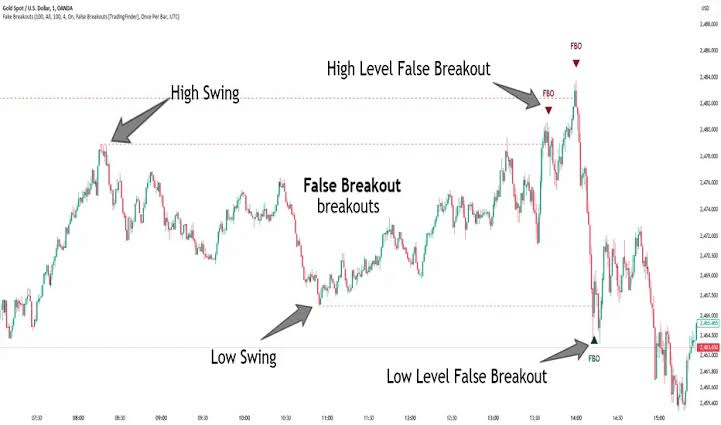
● False Breakout (Liquidity Grab):
A false breakout occurs when price breaks a key level briefly, only to quickly reverse in the opposite direction.
This is typically a liquidity grab designed to trigger stop-losses above swing highs or below swing lows.
Candles that indicate a false breakout:
Pin Bar: Long wick toward the breakout direction with a small body.
Shooting Star or Hammer: Reversal candles signaling rejection.
Example:
If price breaks a swing high, then prints a bearish Pin Bar with a long upper wick, it likely signals a false breakout and a coming drop.
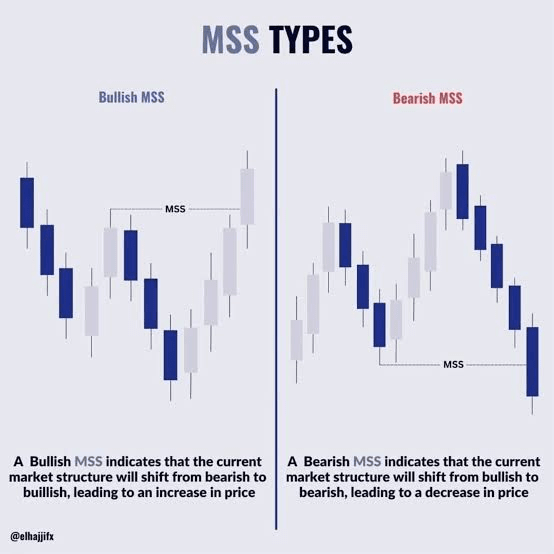
3. Market Structure Shift (MSS):
A Market Structure Shift represents a change in market direction and occurs when the price breaks the structure of the existing trend.
● MSS in a Bullish Trend:
1. Price is forming higher highs and higher lows.
2. A major swing low is broken by a strong bearish candle (e.g., Marubozu).
3. Price tries to go higher again, but fails to make a new high.
4. Instead, it forms a lower high – this confirms a shift to bearish structure.
● MSS in a Bearish Trend:
1. Price is forming lower lows and lower highs.
2. A key swing high is broken by a bullish engulfing candle.
3. Price pulls back, but doesn’t make a new lower low.
4. A higher low forms – this signals a potential bullish reversal.
💡 Practical Use in Trading:
A false breakout is a signal for countertrend entry, especially when followed by a reversal candle.
A true breakout is a signal for trend continuation, especially with a confirming Marubozu or engulfing candle.
An MSS is one of the strongest signals that a new trend may begin, often used as a base for entry setups.
🔍 Example Scenario;
Imagine a bullish trend with the following swing points:
Swing Low at 1.1000.
Swing High at 1.1200.
Higher Low at 1.1100.
Higher High at 1.1300
Then suddenly:
Price breaks below the 1.1100 level with a strong bearish engulfing candle.
It attempts to rise but fails to reach 1.1300, forming a lower high at 1.1250.
This signals a bearish Market Structure Shift.
You can now look for short entries on lower timeframes with confirmation (like FVG or Breaker blocks).
🧪 Exercise – Identify the Shift:
On a 1H chart:
Price is forming lower highs and lower lows.
Suddenly, a bullish Marubozu candle breaks above the last swing high.
Price pulls back and forms a higher low.
What does this indicate?
Like and follow for more 🙏❤


