Institutional tools in trading aren't just technical shapes. They are real traces of smart money activity. By understanding these tools:
Fair Value Gap – Order Block – Breaker
you can position yourself where the smart money trades, and avoid getting trapped in liquidity grabs.
1. ✦ Fair Value Gap (FVG):
Basic Definition:
A Fair Value Gap is a price imbalance caused by a strong candle that moves too quickly, leaving a space where price didn’t trade. Price often comes back later to revisit this area.
How to Spot It?:
It consists of three consecutive candles. If the middle candle is strong and there's a clear gap between the first and third candles (i.e., their wicks don’t overlap), that’s a Fair Value Gap.
Advanced Usage:
Not all FVGs get fully filled. Sometimes price reacts to just a portion of the gap.
FVGs closer to liquidity zones are more effective.
They’re best when aligned with another tool like an Order Block or a Market Structure Break.
2. ✦ Order Block (OB):
Basic Definition:
An Order Block is the last candle before a strong price move. It often signals where institutions entered the market.
Types of Order Blocks:
1. Bullish OB: A bearish candle before a strong bullish move
2. Bearish OB: A bullish candle before a strong bearish move
3. Reversal OB: Appears at the end of a trend
4. Continuation OB: Appears within a trend to support trend continuation
5. Mitigation Block: An OB that has been partially broken and is used to mitigate old institutional orders
Advanced Usage:
OBs are stronger when they align with market structure shifts or liquidity grabs.
Watch for “wick fills” — price may only tap the wick of the OB and still respect the zone.
3. ✦ Breaker:
Basic Definition:
A Breaker is a special kind of candle that initially acted as support or resistance, got broken (often by a liquidity sweep), and then became a powerful re-entry zone upon retest.
Conditions for a Valid Breaker:
Breaks a clear high or low.
Followed by a strong reversal.
Often forms after a liquidity trap.
Advanced Usage:
Breakers are more of reversal tools than continuation tools.
The best breakers occur at obvious swing highs/lows.
Great for confirming end of corrections or full trend reversals.
4. ✦ Relationship to Liquidity:
Institutions always move after collecting liquidity from retail traders.
After a liquidity sweep, they leave traces like OBs or FVGs — those are your clues.
Example: Price sweeps a low (taking out stop losses), reverses strongly, and leaves behind a Breaker — this is textbook smart money behavior.
Sometimes, a single candle can be a Breaker + OB + FVG — such areas are extremely powerful.
5. ✦ How to Use These Tools in Real Trading?
Before entering a trade:
1. Identify market direction (via structure).
2. Look for a break of a high/low — potential Breaker setup.
3. Spot if an FVG formed after the break.
4. Check for an OB in the same area.
5. Wait for price to return to the zone and show confirmation (e.g., reversal candle or engulfing pattern).
6. Enter the trade, place stop loss below/above the tool, and set your target near a liquidity zone.
6. ✍️ Practical Exercise:
Open the BTC or ETH chart on the 4H timeframe:
Identify a high or low that was broken and then price reversed — was a Breaker formed?
Check for a Fair Value Gap after the break.
See if the breaking candle is also an Order Block.
Wait for price to return to the zone — did a confirmation candle appear?
Mark entry, stop loss, and target.
Summary:
Institutional tools are evidence of smart money movement. You can use them confidently when you:
Know how to spot them.
Understand when they are most effective.
Combine them with liquidity context.
Align them with market structure.
✅ Model Answer – Institutional Tools Practical Exercise:
📈 Chart Used: BTC/USDT
⏱️ Timeframe: 4H
📅 Example Date: [Insert recent date – optional]
1. 🔍 Identifying Market Structure:
Market was in a downtrend with lower highs and lower lows.
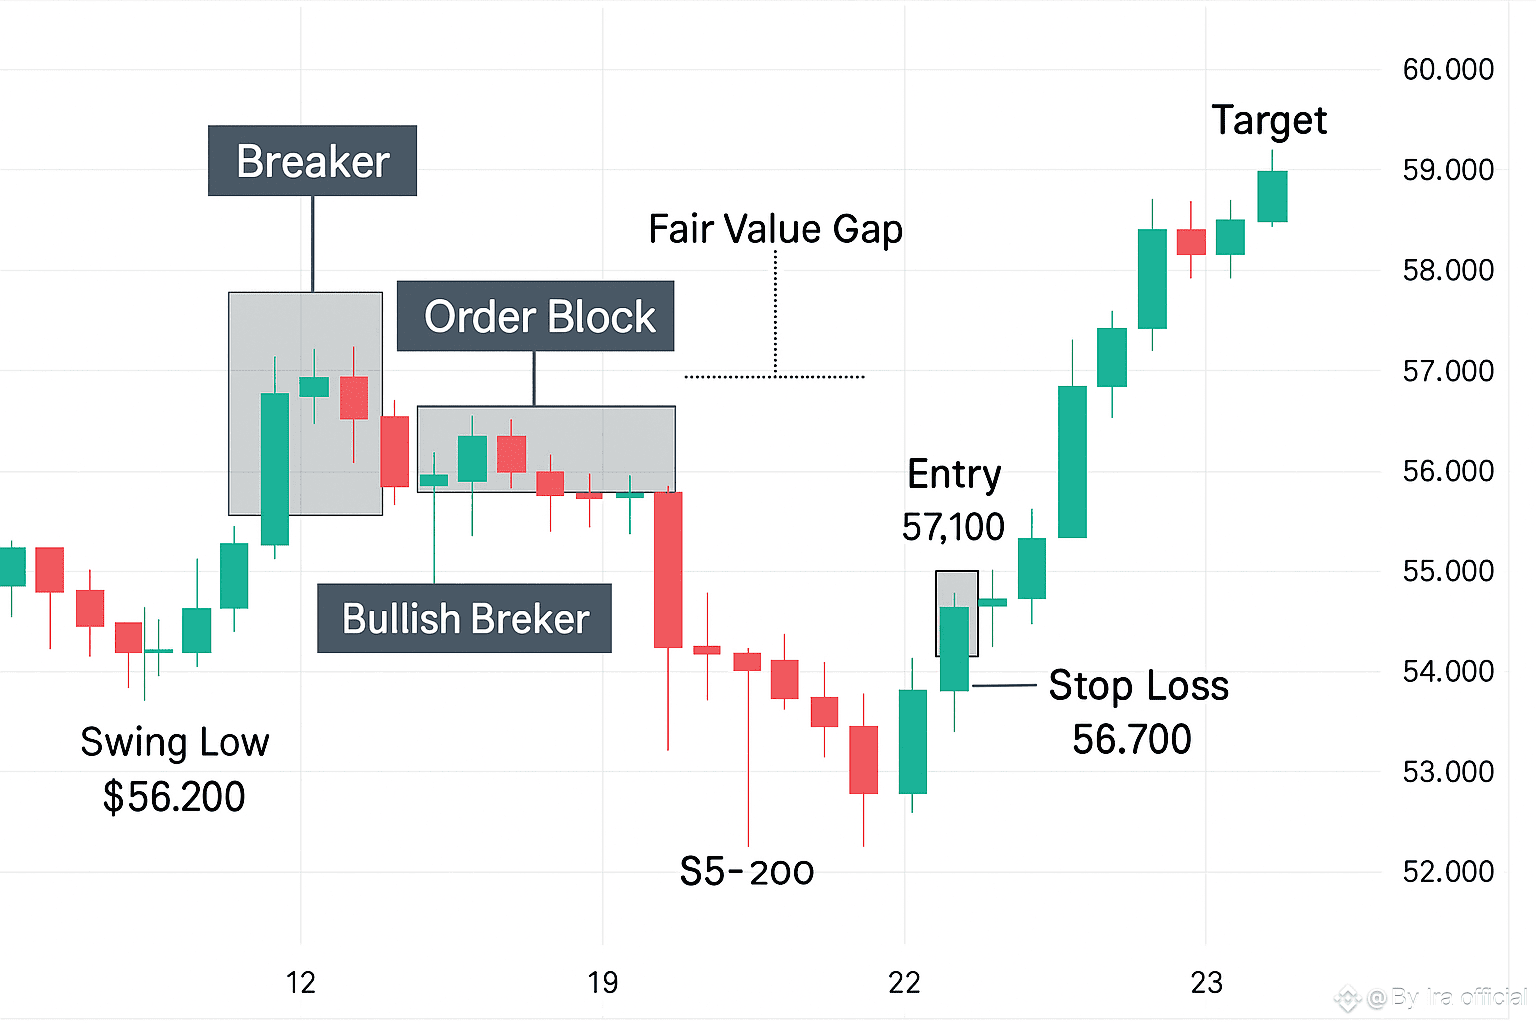
Then, a swing low at $56,200 was taken out (liquidity grab).
✅ Structure shift confirmed after a bullish break above a previous lower high.
2. 📉 Breaker Identified:
Before the break, price swept the low at $56,200 and formed a bullish engulfing candle.
That engulfing candle became a valid Bullish Breaker.
✅ The candle broke the previous resistance and then price came back to test it.
3. 🧱 Order Block Detected:
Just before the strong move upward, a final bearish candle was printed.
This bearish candle was the last down candle before the bullish move.
✅ Marked as a Bullish Order Block.
4. 🕳️ Fair Value Gap Found:
Between three candles during the breakout, a clear gap appeared.
Wick of Candle 1 and Candle 3 didn’t overlap.
✅ Fair Value Gap confirmed around $57,000–$57,300.
5. 📥 Entry Strategy:
Waited for price to return to the FVG/OB/Breaker zone.
On return, a small bullish hammer formed — sign of rejection.
✅ Entered LONG at $57,100
🛑 Stop Loss: Below the Order Block at $56,700
🎯 Target: Previous liquidity high at $59,200
6. 📊 Outcome:
Price respected the zone and went up rapidly.
Take profit hit within 12 hours.
✅ Result: +2.5R gain
🎯 Risk/Reward: 1:2.5
✅ Final Notes:
FVG, OB, and Breaker all aligned in the same area — a confluence zone.
The liquidity sweep + market structure break was the initial confirmation.
#lessonlearned #Binance #CryptoMarket #TradingCommunity #BinanceHODLerTree
