#WCTKING #WCTPricePredictio $WCT
Technical Analysis:
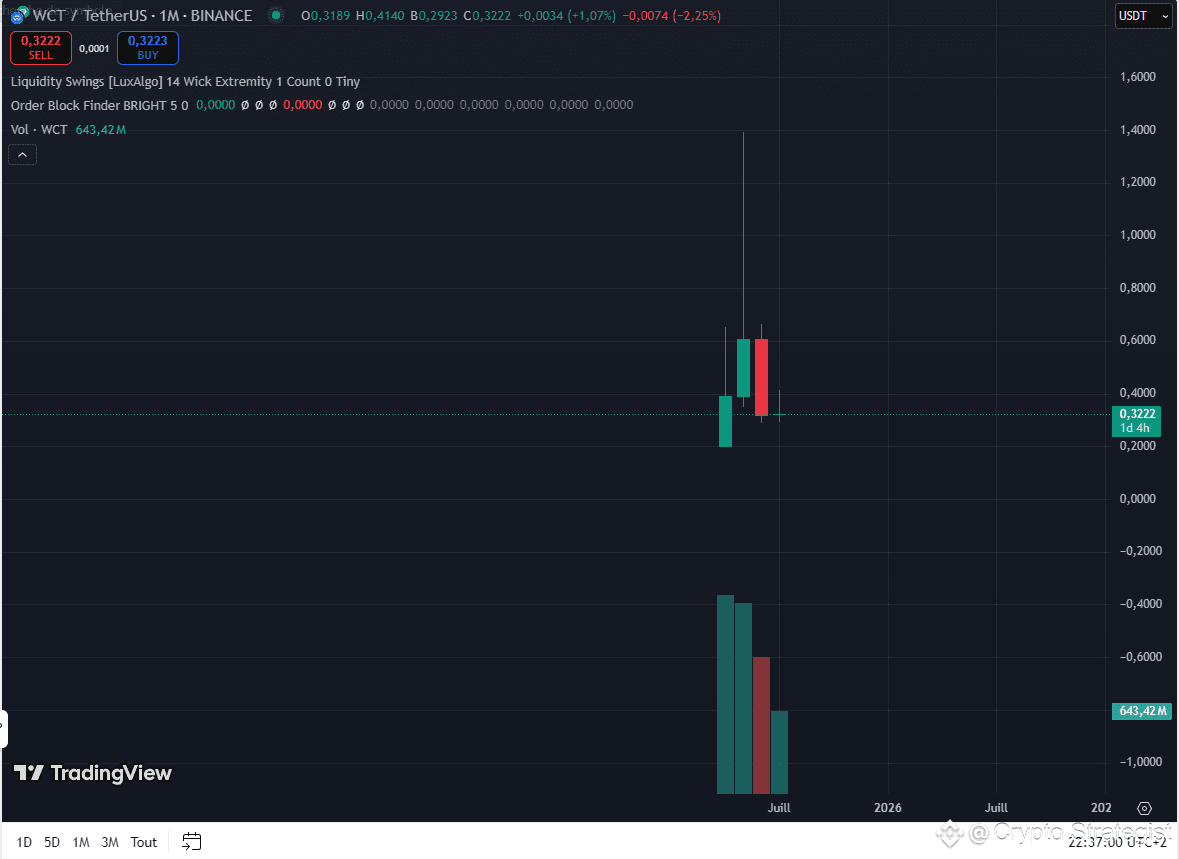
📆 1. Monthly Chart (1M)
Current Price: $0.3222
July monthly candle is about to close (less than 48 hours left)
The current candle shows a long upper wick rejection from above $0.41
🔹 Key Observations:Heavy upper wick last month = Strong buyer rejection
Currently forming a neutral Doji above $0.30 — no bullish confirmation yet
Monthly volume continues to drop, signaling fading bullish momentum
🔥 What the Monthly Close Means:A close below $0.34 confirms bearish continuation into August
A break below $0.30 in early August could trigger a move toward $0.24 – $0.27
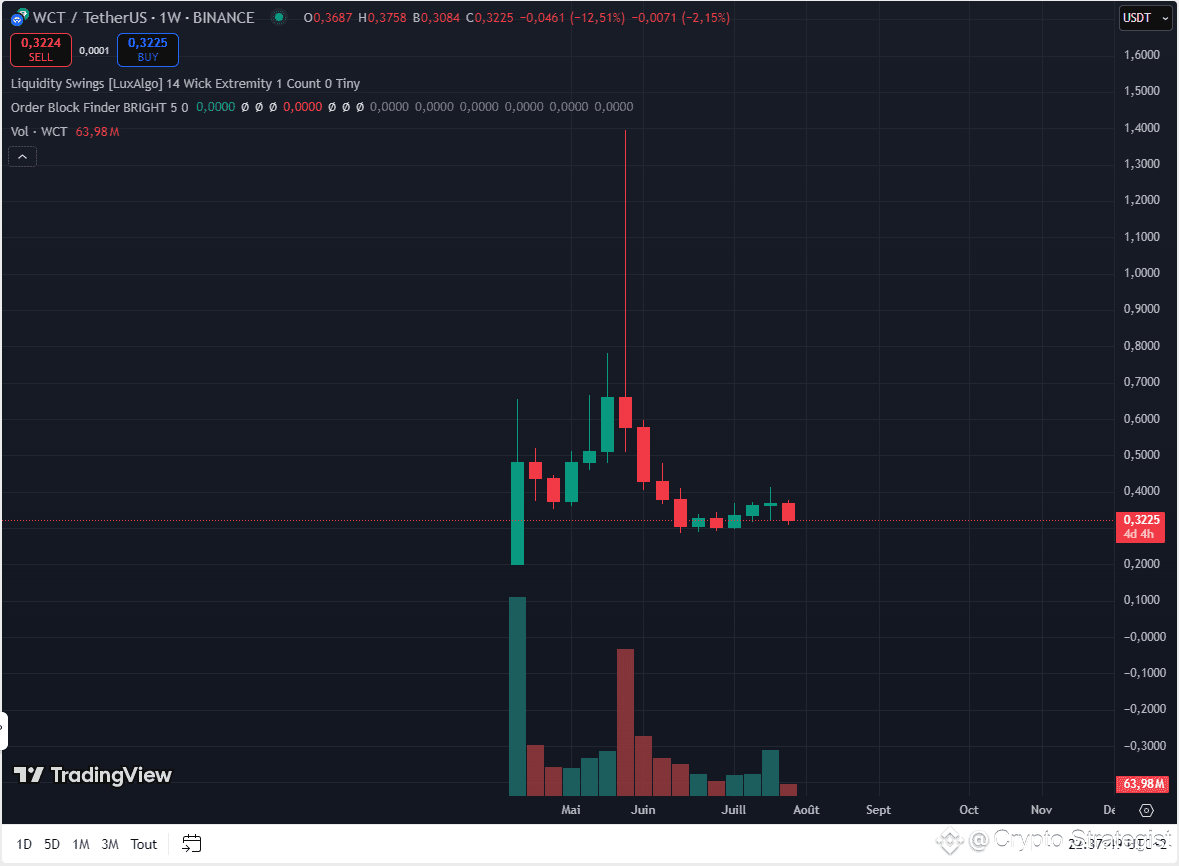
📉 2. Weekly Chart (1W)
Price got rejected at $0.3758 and dropped back to $0.3225
Candles show indecision (Doji / weak hammers)
🔹 Key Zones:🔻 Strong demand zone: $0.2920 – $0.3100
🔺 Immediate resistance: $0.3530, then $0.4014
🔸 Volume:Weak buying volume on the bounce = lack of conviction for a breakout
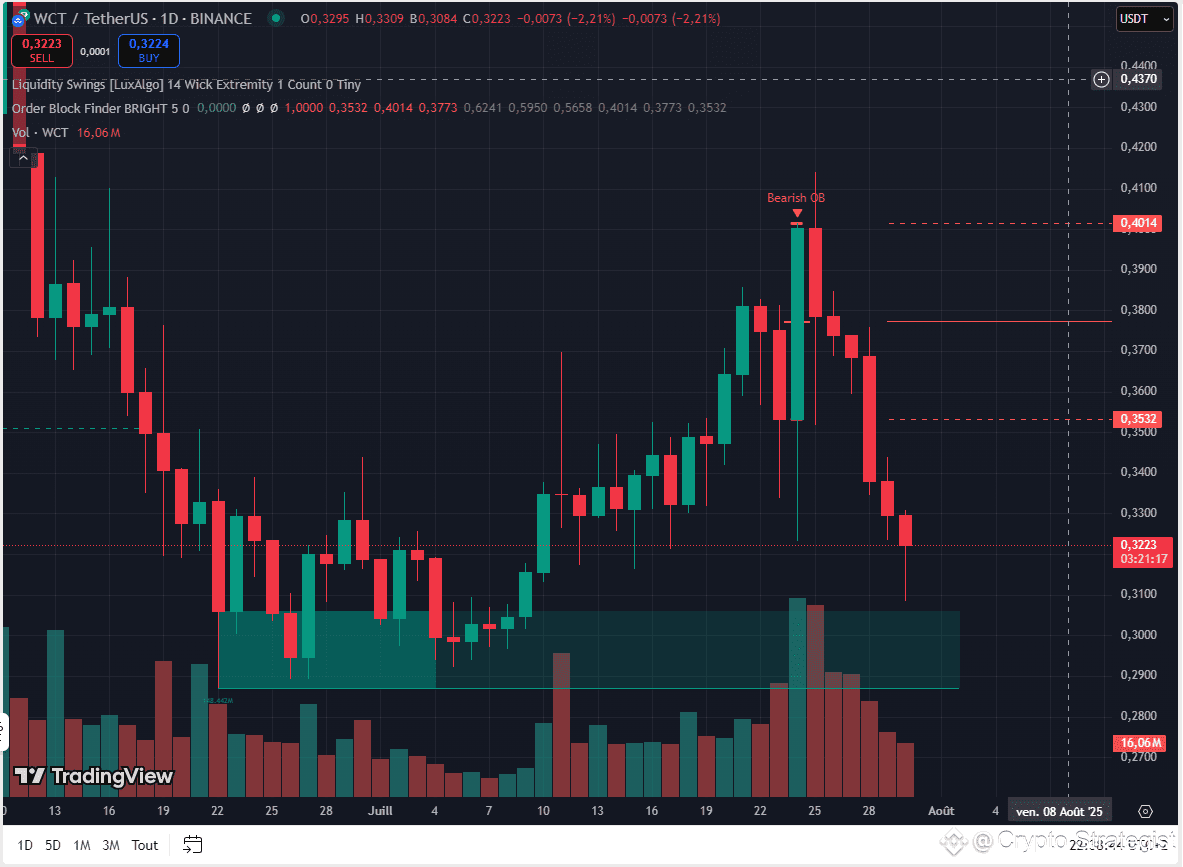
📅 3. Daily Chart (1D)
Several bearish candles after rejection from a Bearish Order Block (OB) around $0.4014
Price now retesting a clear Demand Zone: $0.2900 – $0.3200
💥 Notables:OB rejection = confirmed resistance
Low volume during pullback = exhaustion, not panic
Structure remains neutral unless $0.29 breaks on closing basis
📊 Estimated Indicators (visually interpreted):
RSI likely under 50 → weak bullish momentum
EMA 20/50: Bearish crossover happened recently
Volume: Weak — suggests short-term correction, not collapse yet
🎯 Trading Strategy Ideas:
🔽 If $0.29 Breaks With Daily/Weekly Close:
Sell Entry: $0.3200$WCT
Stop-Loss: $0.3530
Take-Profit 1: $0.2750
Take-Profit 2: $0.2470 (Fibo 1.618 extension)
🔼 If Price Bounces With Strong Bullish Candle:
Buy Entry: Only after bullish engulfing pattern$WCT
Stop-Loss: $0.2850
TP1: $0.3530
TP2: $0.4010
⏰ Why This Monthly Close Matters:
It defines the directional bias for August:
🔴 Close below $0.30 = likely bearish continuation
🟢 Close above $0.35 = chance for bullish recovery
✅ Summary Table:
Indicator
Status
Trend
Weak Bearish
Critical Zone
$0.29 – $0.32
Trade Setup
Sell on breakdown, Buy on reversal
Note
Monthly close will confirm the path