We can divide technical analysis into several sections (important)
Classical analysis: it relies on classical tools such as lines, bars, and points; classical meaning very simple. This is what this article will discuss.
As for the other three types, which are considered modern and advanced, there will be detailed articles such as: Harmonic, Elliott, Price Action, which also help in understanding the market's situation.
What is classical analysis and its tools?
There are 6 things you need to know well:
Japanese candlesticks
Trend lines
Support and resistance lines
The most important technical indicators
Technical patterns
Capital management
Now focus
If you understand these six classical matters, you will know well the most important market movements.
Follow me
First: Japanese candlestick analysis
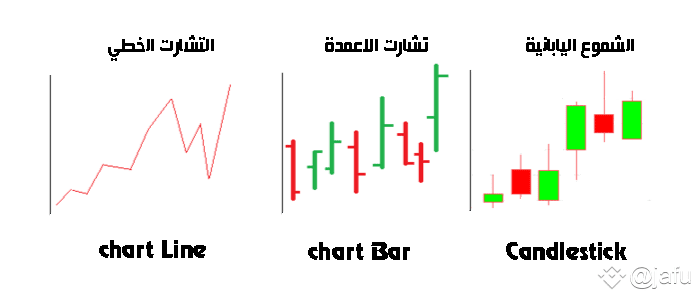
We all know that there are 3 types of charts (graphs):
Line chart – simply put, it is viewing price movement in the form of a line.
Bar chart – is viewing price movement in the form of bars, as shown in the image, where the left line represents the opening of the bar, and the right line represents its closing.
Japanese candlestick chart – it is the most traded, it also has a beginning and an end, and it forms a tail or shadow from the top or bottom depending on the movement.
However, all traders and analysts rely primarily on Japanese candlesticks for their ease of reading and providing accurate information.
You can also rely on line drawing, which is also useful in determining trend direction and analysis.
But very few use bar charts due to their complexity, and I do not recommend them; just take a look at them for knowledge.
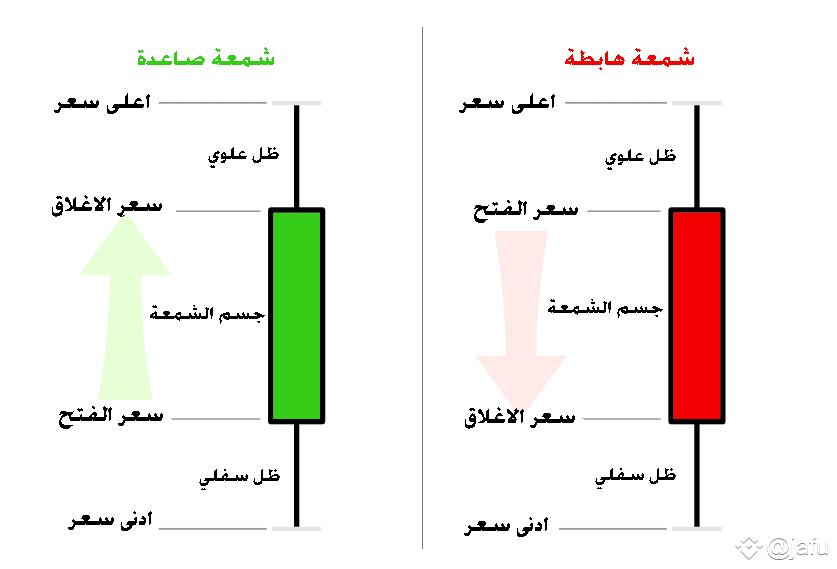
What are the components of the Japanese candlestick and its anatomy.
It consists of the body of the candle and the tail of the candle or the candle's shadow.
The candle has two shadows: an upper shadow and a lower shadow.
The top shadow's head (highest price) and the bottom shadow's head (lowest price)
The body of the candle has an opening point and a closing point.
Second: Trend lines
What does trend mean: The trend is the direction, and it is the market's path from which you know where prices are going, whether they are rising, falling, or parallel.
The most important point you should know during trading and analysis is to always be in the direction of the trend; if it's upward, you should follow the market and buy on the rise, and if it's downward, you should also follow it down and sell. If it's parallel, it's preferable not to trade.
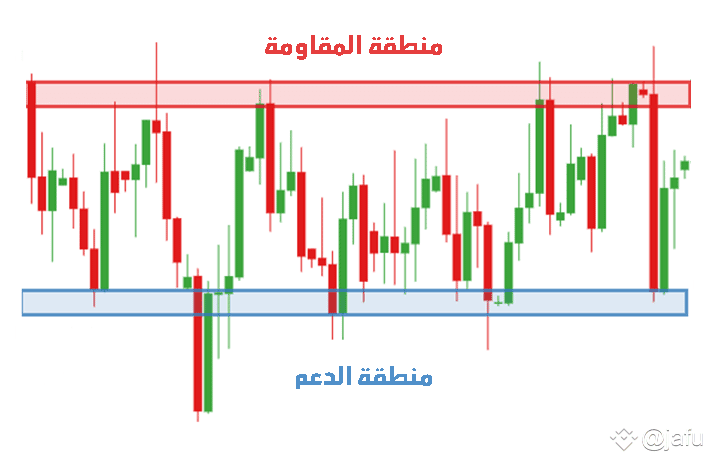
Third: Support and Resistance
One of the most important fundamentals of technical analysis, if we want to explain support and resistance, is: any area on the chart (graph) from which the price bounces back.
You can also use pivot points and Fibonacci levels to draw supports and resistances.
A general rule:
Every trough from which the price rebounds is support, and every peak from which the price rebounds is resistance.
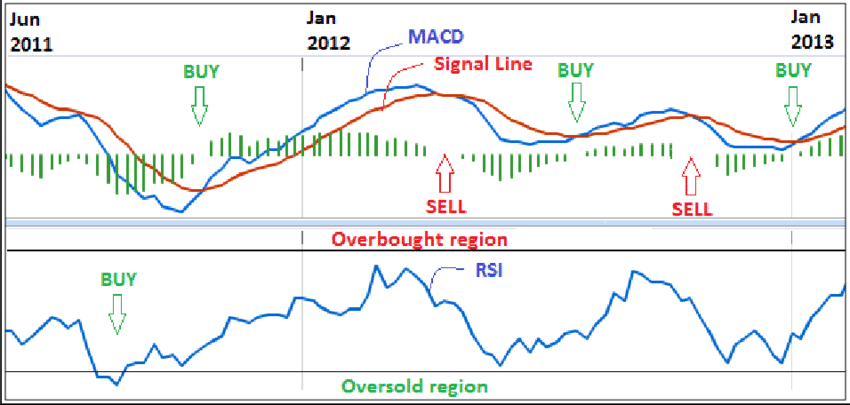
Fourth: Types of technical indicators in technical analysis
We can divide the work or types of technical indicators into four main types:
Indicators that help you understand the direction: like the MACD indicator – Moving Average.
Indicators that help you understand momentum (market movement speed): like the RSI indicator – ADX indicator.
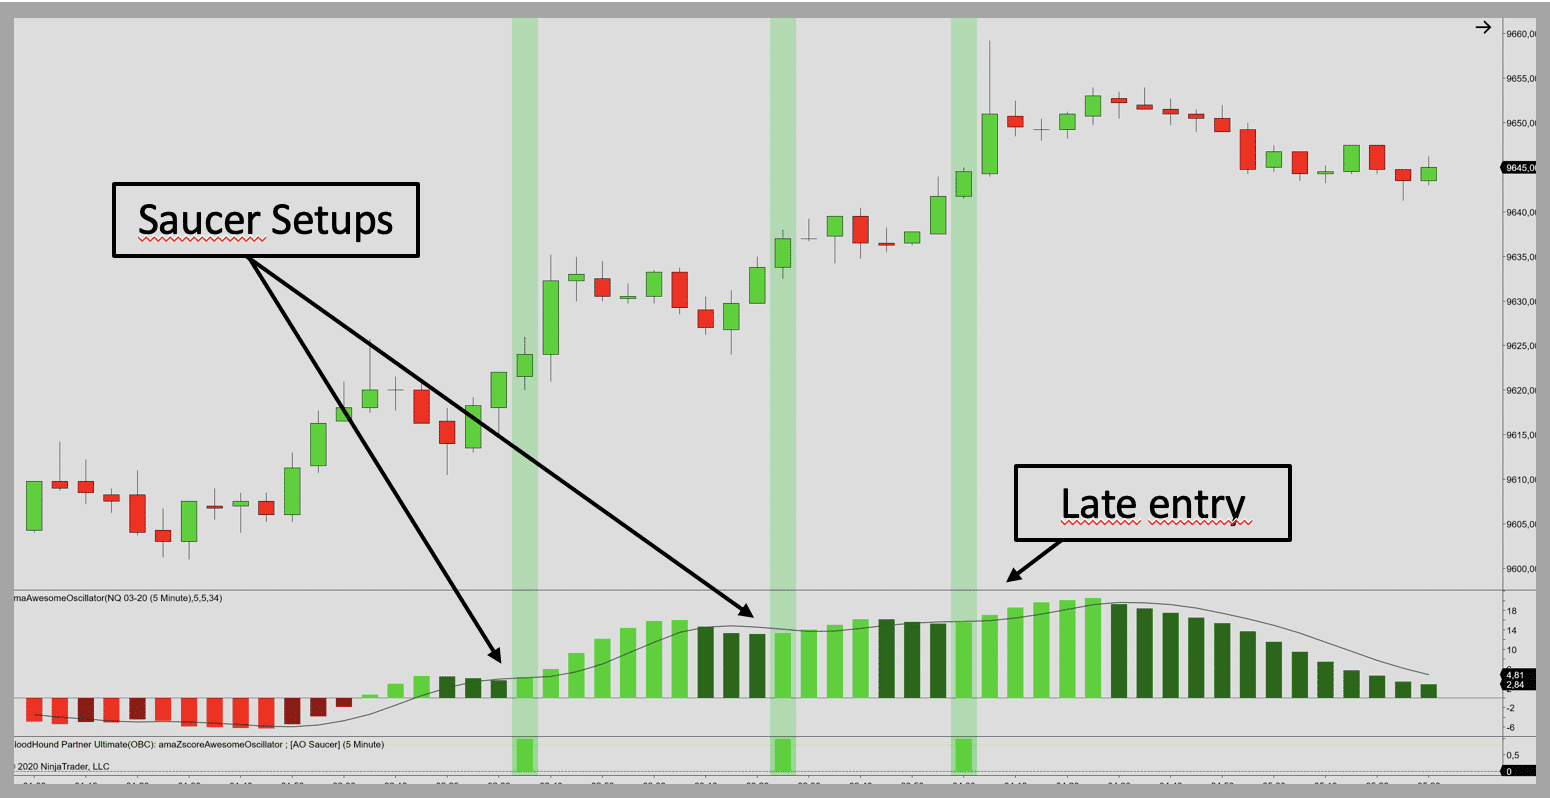
Indicators that help determine the liquidity size that indicates the strength of the movement: like the Oscillator indicator.
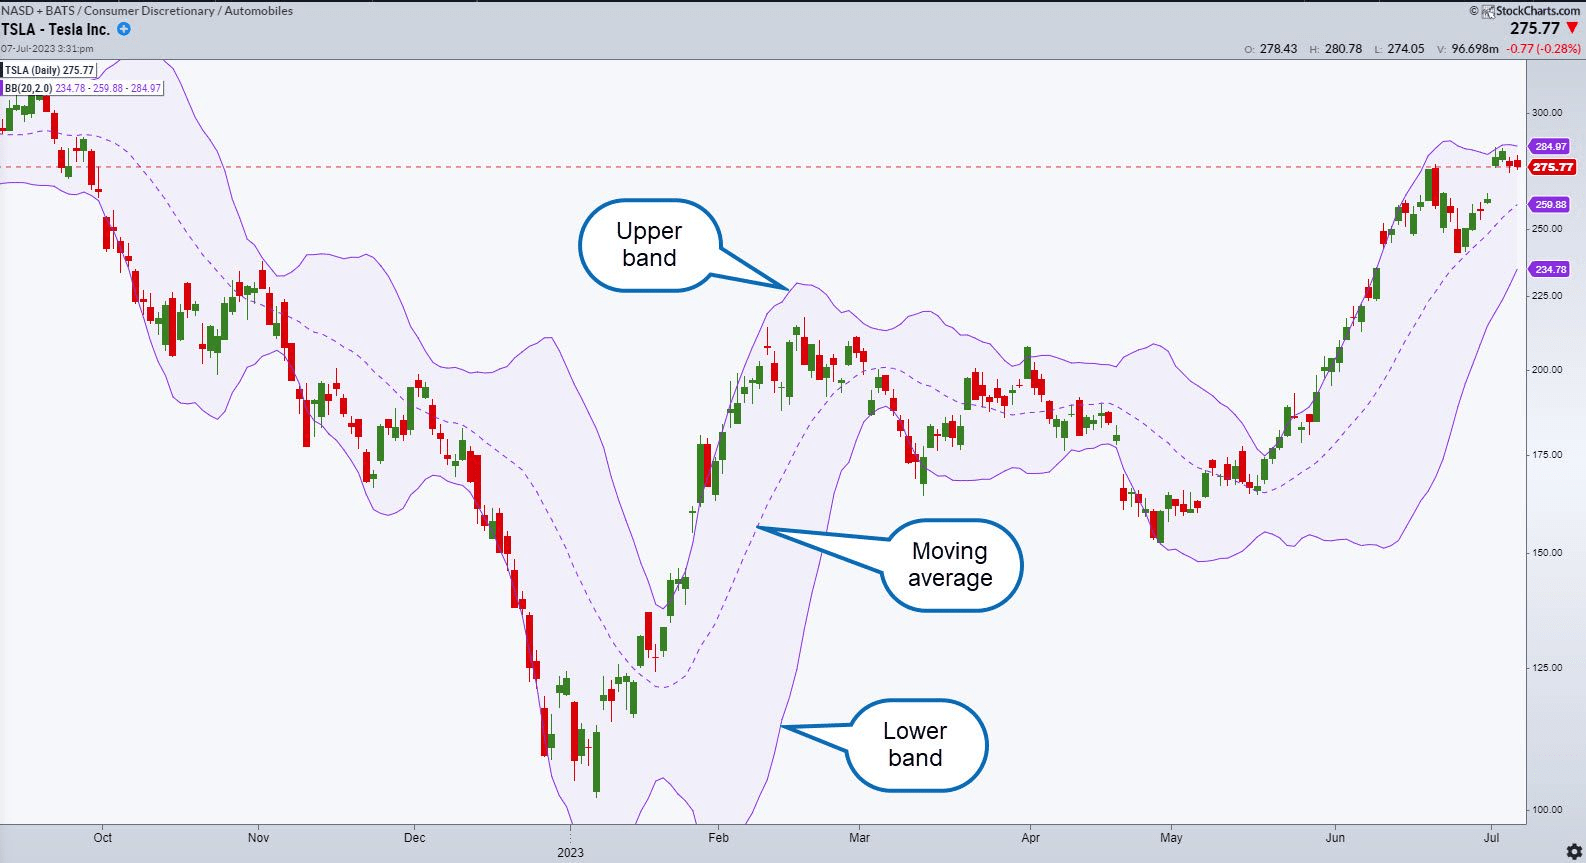
Indicators that help study market fluctuations: like the Bollinger Bands indicator.
You should know that each of these indicators has its own mechanism and specific strategies, as there are mixtures between several indicators to form a unique strategy.
There are those who use intraday scalping strategies, i.e., in the short term.
There are those who use daily trading strategies over a medium or long term.
Fifth: The most important patterns and models in technical analysis
These are known and famous shapes you see on the chart, helping you determine the direction or change of direction and predict its target. I will present to you the most famous group of them now.
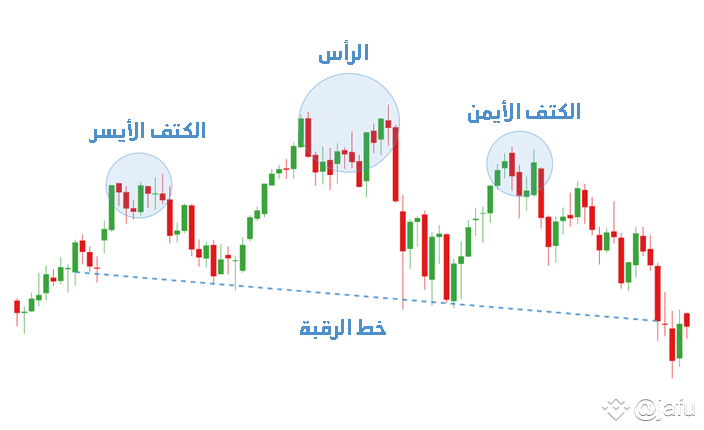
1. Head and Shoulders
It consists of 3 peaks divided into one peak at the top and two peaks at the bottom from each side, in the shape of a head and shoulders as shown in the image. The price explodes upon breaking the neck line, and it can have 3 troughs, where there is one trough at the bottom and two troughs on each side, which are the shoulders.
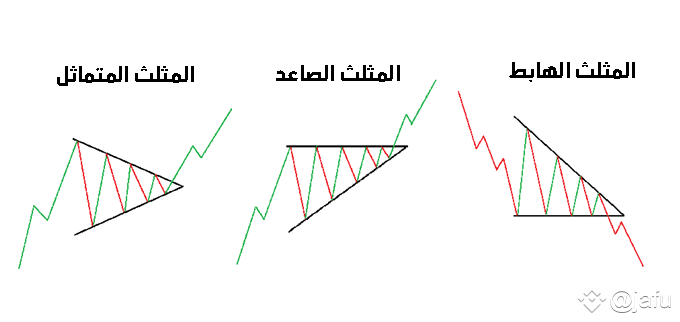
2. Ascending / descending triangle
As you see in the image, it has a level line and a slanted line, and since it is high, after a wave of price increases, prices become compressed and constrained within the triangle, leading to a price explosion upwards. As for the descending triangle, it is the complete opposite.
3. Symmetrical triangle
It consists of two slanted lines as shown in the image, and it also leads to price constriction, leading to a price explosion according to the first wave's trend line.
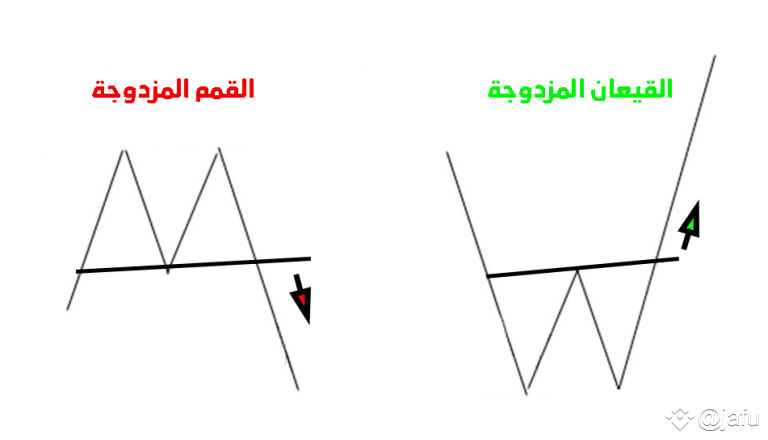
4. Double top / Double bottom
It consists of two peaks at the top and a trough in the middle, and when the price returns and breaks the trough downwards, it indicates a price drop; the opposite is considered a double bottom, and this image illustrates the pattern.
Note:
Peaks and troughs can have three heads
5. Continuation wedge
It consists of two slanted lines leading to price constriction, and before the triangle forms, the price explodes in the same direction as the first wave.
6. Inverted wedge
It also consists of two slanted lines leading to price constriction, and before the triangle forms, the price explodes in the opposite direction.
There are also patterns for Elliott waves and patterns for harmonic triangles, which are considered an advanced level in technical analysis; you can see their comprehensive guide on the site.
Note:
Always try not to guess the pattern before it is complete and wait for all of its conditions to be met.
Sixth: Capital management
It is setting controls and foundations on yourself to determine the amount of money used in the trade you will enter.
At the same time, determining the allowable risk size from your capital.
For example: if you have $1000, what is the amount you will trade with? Is it $100 or $200?
And if you lose, how will you deal with the loss? Will you continue trading today or tomorrow?
All of this should be in your plan, and you should adhere to it.
Appreciate my effort, friends.. and share it, and if you believe I deserve better than that, please don't forget to support me 🌹♥️
