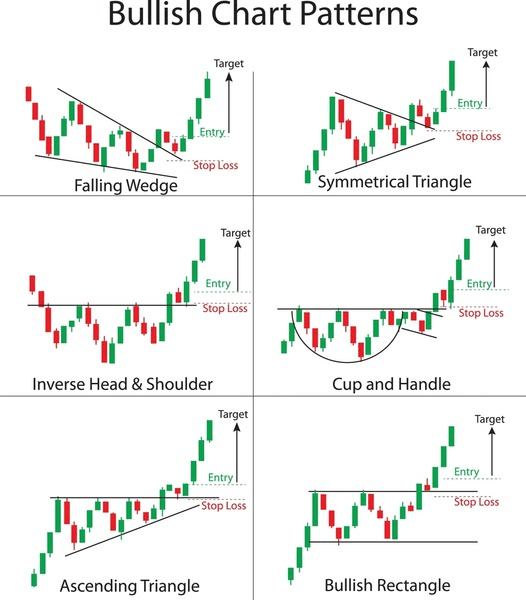
1️⃣ Falling Wedge 🔽➡️🔼
A bullish reversal pattern seen after a downtrend.
📍 Entry: When price breaks above the wedge
🛑 Stop Loss: Below recent swing low
🎯 Target: Height of wedge from breakout point
---
2️⃣ Symmetrical Triangle 🔺🔺
A sign of price consolidation before a breakout!
📍 Entry: After breakout above triangle
🛑 Stop Loss: Below support trendline
🎯 Target: Triangle height from breakout
---
3️⃣ Inverse Head & Shoulders 🧍♂️🔄
A classic reversal pattern after a downtrend!
📍 Entry: Breakout above neckline
🛑 Stop Loss: Below right shoulder
🎯 Target: Distance from head to neckline
---
4️⃣ Cup and Handle ☕📈
A smooth U-shaped recovery followed by a breakout 📊
📍 Entry: Breakout above handle
🛑 Stop Loss: Below handle
🎯 Target: Depth of the cup
---
5️⃣ Ascending Triangle 📐📈
A continuation pattern that signals strength! 💪
📍 Entry: Breakout above resistance
🛑 Stop Loss: Below support trendline
🎯 Target: Triangle height
---
6️⃣ Bullish Rectangle 🔲📈
Price bounces between support & resistance before breaking out!
📍 Entry: Break above rectangle resistance
🛑 Stop Loss: Below support
🎯 Target: Height of the rectangle
---
🔔 PRO TIP: Always confirm breakouts with volume and candle strength!
💹 Combine patterns with RSI/MACD for better signals!
---
📸 Here are the candle patterns below 👇
💬 Found this helpful?
Please Like ❤️ | Comment 💭 | Follow ✅ for more crypto insights!
Let’s ride the bull market together 🐂🚀
#ETHCorporateReserves #BinanceHODLerTree #DELABSBinanceTGE #BNBATH #US-EUTradeAgreement