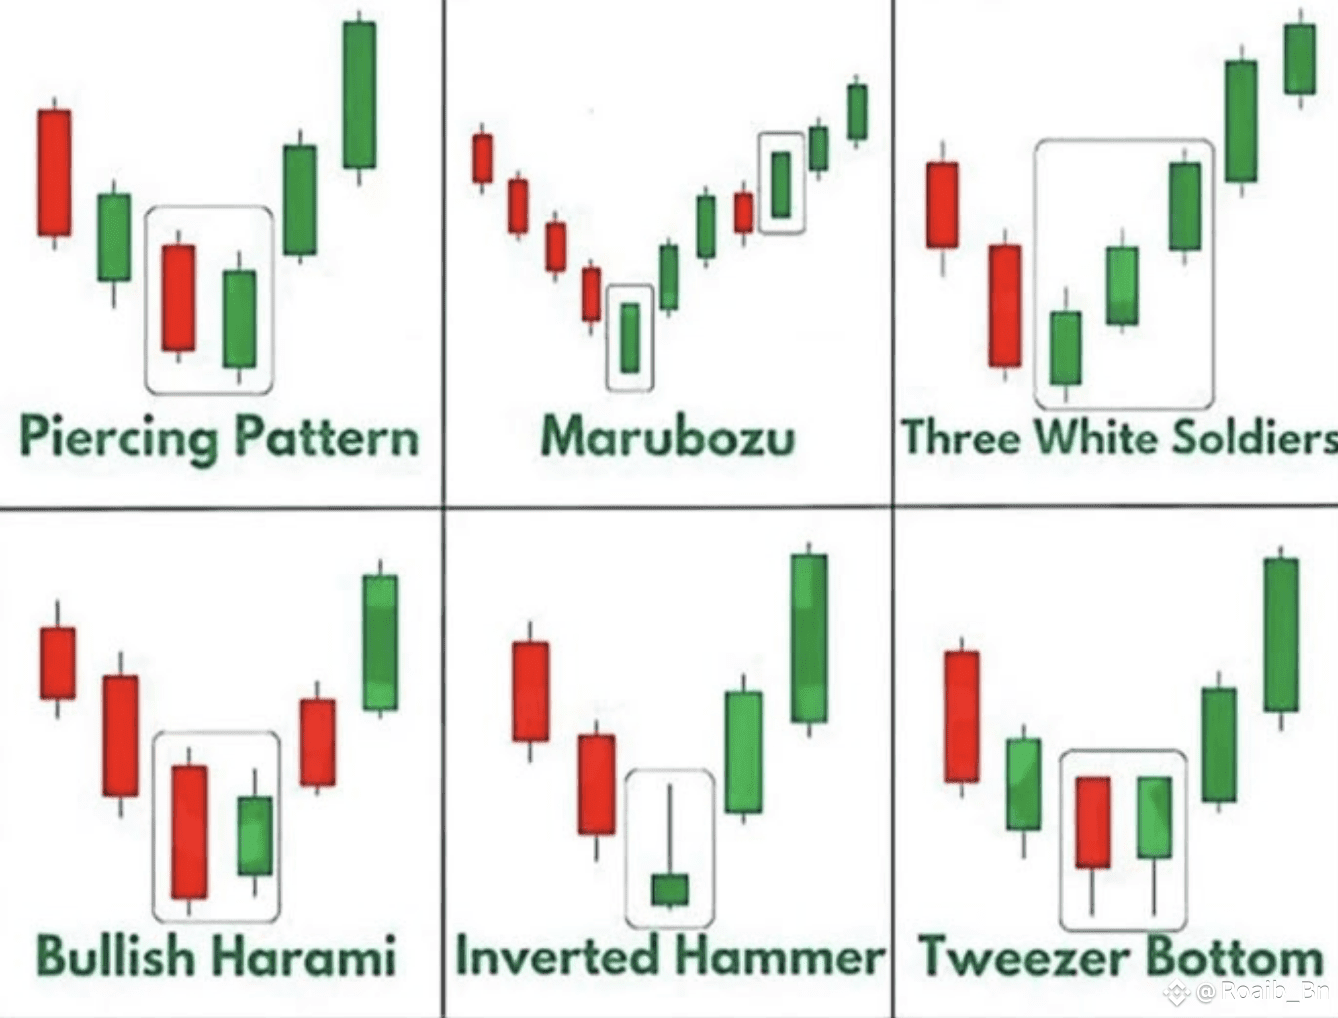
🔼 1. Piercing Pattern
🔻 First candle is strong red.
🟢 Second candle opens lower but closes more than 50% into the previous red candle.
➡️ Signal: Bullish reversal from a downtrend.
---
🔼 2. Marubozu
🟢 A single candle with no upper or lower shadow — full body.
🔄 Can be bullish (green) or bearish (red).
➡️ Signal: Strong conviction by buyers or sellers.
(Bullish Marubozu = strong buying momentum)
---
🔼 3. Three White Soldiers
🟢 Three consecutive green candles.
📈 Each opens within the previous candle and closes higher.
➡️ Signal: Strong bullish trend continuation.
---
🔼 4. Bullish Harami
🔻 A large red candle followed by a small green candle inside it.
📉 Happens during a downtrend.
➡️ Signal: Trend may be reversing to bullish.
---
🔼 5. Inverted Hammer
🔻 Appears after a downtrend.
🕯️ Small body at the bottom, long upper wick.
➡️ Signal: Buyers tried to push price higher — possible reversal coming.
---
🔼 6. Tweezer Bottom
🔻 Two candles with almost equal lows (one red, one green).
🛡️ Indicates strong support level.
➡️ Signal: Bullish reversal from the bottom.
Here is the candles image 👇
✅ Tip: Use these patterns with other confirmations like RSI, volume, and trendlines for better accuracy.
IF you find the post helpful then please follow like and comment on it thanks 👍
#ETHCorporateReserves #BinanceHODLerTree #DELABSBinanceTGE #BNBATH #US-EUTradeAgreement