During this period, I have made money and lost money, and tried everything from dog trading, ICO, and mining. I have experienced countless pitfalls. It can be said to be a game between long and short, but it is more like the management of mentality. There are surprises and disappointments. It is a magical circle, a place full of charm. I have summed up countless operating methods and strategies. To make money, it is simple and rough. Buy in a bear market and sell in a bull market. It is a steady profit.

Mastery: Technology + Mindset + Market = Trading Highlights
Looking back at the highlights of all top traders, they are all the result of the perfect combination of the following three things:
The technology just matches the market rhythm, and the mentality is in a "super natural" state.
Sometimes the technology hasn’t actually changed, but your mindset suddenly becomes clear, and the market happens to enter a rhythm that you are familiar with, then it is possible to generate legendary returns.
on the contrary--
No matter how good your strategy is or how impressive your indicators are, if the market is not suitable for you and you are restless and panicky, then your technology is just scrap metal.
This is the truth of the deal.
Reverse thinking experiment: What if you were asked to “lose 1 million in a week”?
If I give you 1 million and ask you to lose it all within a week, and I will shoot you if you fail to do so, what will you do?
Some people might say: "Go big and bet big on the non-farm payrolls." But what if your bet is right? You'll double your money, which makes it harder to lose it all.
A smarter person would say: "I'll lose all my commissions by trading back and forth so frequently." That's one possible solution.
But this is just an appearance. The key point is: you will find that losing money also requires method and discipline.
You cannot hesitate. Once you make a profit, cut it immediately to avoid "making too much money" and reverse all the logic you think is correct.
If there is a floating loss, you will "hope to lose more" and let it go to the end.
This is the negative discipline system. Losing money rationally and making money emotionally follow the same logic.
After understanding the rules of the game, you will begin to reflect——
In the past, you "clearly had discipline, but still suffered frequent losses". Have you actually been using the "discipline of losing money to make money"?
Inner Demon: The most important thing to let go of is how much money you have lost
The reason why many people cannot turn things around is not because they don’t know how to trade, but because they keep holding on to past losses and thinking, “I want to make it back.”
This is like the down-and-out master in martial arts novels, who is bent on avenging his humiliation but ends up going astray.
You are not trading, you are rehashing old accounts.
A real turning point often starts with one sentence:
"I acknowledged that those losses were a reflection of my current abilities, and I let them go."
Only by letting go of the obsession with the past can we use our "present self" to build a new system and get out of the quagmire.
Building Your Trading System: Don’t Be a Jack of All Traders, Be a Master of One
I am not a genius. I don’t know how to capture trends, nor am I an on-chain Alpha hunter. I don’t understand macro interest rates, and I don’t know how to do quantitative grids.
I'm just a swing trader.
Every day is like a bodyguard in the underworld, choosing a route, transporting a load of goods, running back and forth, relying on a sense of rhythm and a "sense" of opportunity.
I don’t preach big principles, and I don’t predict whether “BTC can rise to $150,000”.
These "mythological narratives" are useless to me. My trading is to find the current opportunity one by one and then complete it cleanly and neatly.
Just like the Eighteen Bronze Men Formation of Shaolin Temple, it doesn’t require you to master a thousand martial arts, it only requires you to practice one move to perfection.
The road to trading: focus on polishing and integrating
My strategy is not isolated. I focus on my own swing trading and also learn from the ideas of my seniors.
I took their experience and fed it back into my own strategy system to make it smoother and more powerful.
This is a process of integration and mastery, where all rivers flow into the sea. It is not about greed, but about selecting the best.
Just like Zhang Sanfeng transformed the moves of Shaolin, Wudang, Emei and Kunlun into Tai Chi - the great way is simple and unique.
Don't use your faith to pressure others, I'm just a short-term trader
You believe that BTC will rise to a million, that is your belief. But don't try to force your belief on others.
I am just an ordinary person who makes a living by short-term trading. I work hard in the market every day with diligence and sense of rhythm.
You eat the long-term fruits, and I will just nibble on the short-term meat.
Just like some masters in the martial arts world establish their own schools, while others rely on a "Dragon Slaying Sword" to travel around the country - each accepts their fate and does not disturb each other.
The following is a trading strategy with a winning rate of over 80%. I spent 2 years, hundreds of days and nights, and drew thousands of charts to study and summarize these top trend continuation chart patterns. Once you learn and master them, the cryptocurrency market will be your "ATM"
Regarding moving averages, we generally believe that short-term moving averages that closely track the K-line chart are more indicative of current market volatility. For convenience, multiple moving averages are often used in combination, and short-term moving averages rarely appear alone. However, there are exceptions. The 5-day moving average (MA5), a typical short-term moving average, is particularly unique when used alone, due to its usefulness in identifying short-term market trends and exiting trades.
Moving averages primarily serve the following functions: indicating trends, identifying support and resistance levels, and highlighting short-term market fluctuations. Longer-term moving averages fulfill the first two functions, while shorter-term moving averages, closely tracking candlestick patterns, are more effective at revealing short-term fluctuations. Shorter-term moving averages, when viewed in isolation, rarely provide direct trading assistance, with the 5-day moving average being an exception.
Commonly used short-term moving averages include the 5-day, 10-day, 20-day, and 30-day moving averages. Today, I'd like to share with you the fascinating uses of the 5-day moving average. As the saying goes, "If the five-day moving average remains intact, no action is necessary." The five-day moving average mentioned here refers to the 5-day moving average.
As we all know, the moving average is actually the abbreviation of the simple moving average (SMA) indicator. As the name suggests, the 5-day moving average is the average of the transaction price or index of stocks or other commodities over 5 days. It corresponds to the 5-day moving average of the price and the 5-day moving average of the index.
This short-term moving average with a parameter of only 5 is difficult to indicate entry and is unable to provide clear trend direction and price prompts, but it does have certain advantages in confirming short-term trends and exiting the market.
Confirm short-term (ultra-short-term) trends
When the market's K-line closes consecutively with negative candlesticks (a decline) or positive candlesticks (an increase), the 5-day moving average becomes a support level for positive candlesticks and a resistance level for negative candlesticks (i.e., if the K-line closes above the 5-day moving average during an uptrend or below the 5-day moving average during a downtrend, it is not recommended to use the 5-day moving average as a key price indicator). However, if the short-term market trend is weak or consolidating, the 5-day moving average will cross the body of the K-line.
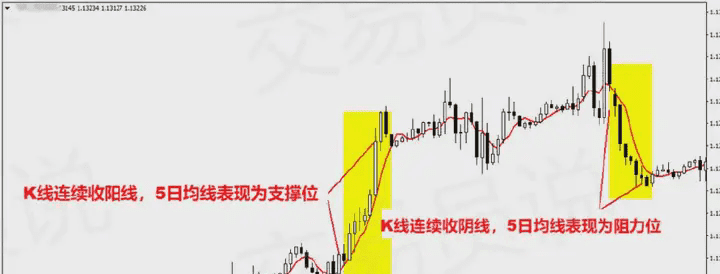
The above chart is more than just a description; it can also serve as a confirmation of the market's short-term trend: If at least two consecutive candlesticks close above the 5-day moving average (preferably with positive candlesticks), it indicates strong bullish momentum in the short term, and prices may rise rapidly. Similarly, if at least two consecutive candlesticks close below the 5-day moving average (preferably with negative candlesticks), it indicates strong bearish momentum in the short term, and prices may fall rapidly. Even if a reversal candlestick occasionally closes, as long as the 5-day moving average, which serves as support or resistance, is not a cause for concern.
The significance of this application is that if you have short-term positions, when the 5-day moving average shows the above performance, you can enhance your confidence in holding positions, and there is no need to exit the market before the 5-day moving average is broken by the reverse K-line entity.
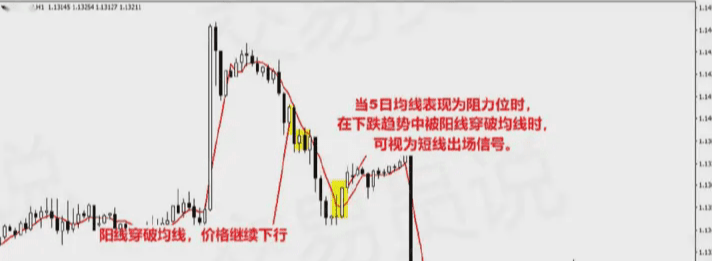
In addition, during the operation, there may be a positive line breaking through the 5-day moving average, or if the 5-day moving average is a resistance level and is broken through by a negative line entity, there is no need to worry for the time being, and the short-term trend will continue.
Tips for exit
Corresponding to the aforementioned 5-day moving average becoming the support and resistance level of the K-line, when the 5-day moving average breaks through the K-line body, it often indicates a temporary halt in the unilateral trend or a weakening of the overall trend. Therefore, when the 5-day moving average, which has changed from a support or resistance level, is suddenly broken through by the opposite K-line, this can be treated as a short-term exit signal.
It should be noted that the 5-day moving average can be used as an exit signal only when it is displayed as a K-line support or resistance level.
Whenever the 5-day moving average can be used to prompt an exit, the timing of the prompt is often quite good.
Regarding this exit strategy, the 5-day moving average can be used in conjunction with a candlestick reversal pattern. When a candlestick pattern such as a piercing pattern, dark cloud cover, evening star, or morning star appears, observe whether the candlestick breaks through the 5-day moving average to determine whether a short-term exit is warranted.
For the use of the 5-day moving average, any chart time frame can be used.
5X5 Trading Strategy
The 5X5 trading strategy is well-suited for short-term price fluctuations. Combining the 5-period Relative Strength Index (RSI) with the 5-period Simple Moving Average (SMA) creates a powerful combination that combines momentum with trend.
Using the RSI
The RSI can indicate overbought and oversold price conditions. While it doesn't guarantee a price reversal, it can help show the extent of price momentum. This can be used to predict a price reaction in the opposite direction.
When we see the RSI line below 30, we consider the underlying asset to be oversold. At this point, we look for signs of a price rebound. Overbought levels are indicated by an RSI line above 70. The 50 level is used as a "short to long" or "long to short" indicator.
How to use the 5 SMA
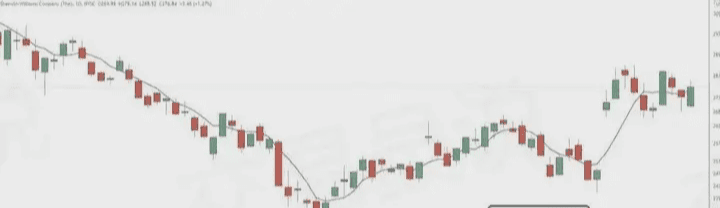
The moving average will act as a trend indicator based on the slope and can also be used as an entry signal.
When the overall slope is downward, we will be looking for short trading opportunities. An upward slope will provide us with long signals.
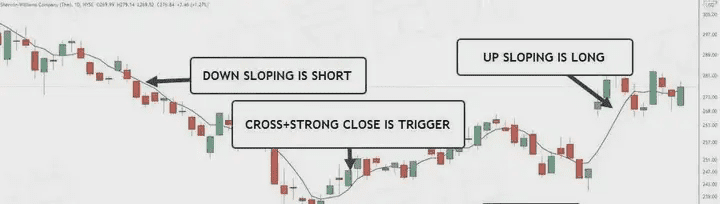
When the price crosses the SMA and closes strongly, combined with other conditions, we can consider it as a signal to place a buy or sell order.
Profit Taking
There are many ways to achieve profit, and every trader will have their own preferences. Whether using a trailing stop or a take-profit tool, both are effective ways to close a position. In this example, we will consider a 1R profit target.
A 1R profit target means that the amount of profit you make is equal to the amount you risk.
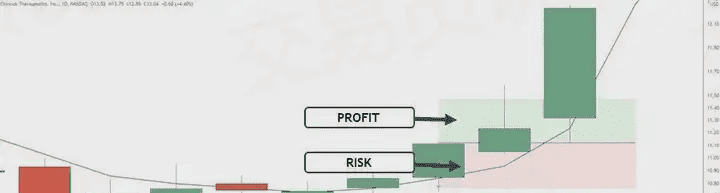
For example, in this example, the protective stop is set below the candlestick with a stop loss amount of 0.35. The buy stop is set above the high with a take profit target of 0.35.
This method of finding 1R target profit is not only suitable for simulated trading, but also for real trading.
What is a buy signal?
When we look for a long trade, we need to see the RSI break above the 50 level and the price close strongly above the 5-day Simple Moving Average (SMA). Although the RSI may have broken out a few candlesticks ago, we seek to avoid entering a trade when the price is overextended.
If the RSI rebounds from the oversold area and is about to break through the 50 line, we can also enter the market early.
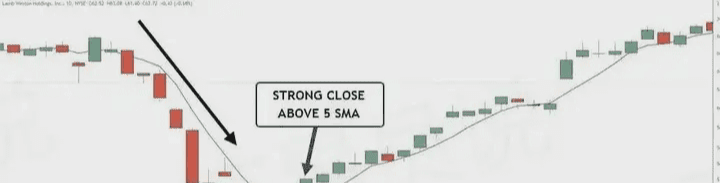
When prices rebounded from a downtrend, the RSI entered oversold territory. The RSI rose sharply, and prices subsequently closed strongly above the simple moving average. A buy stop-loss order was placed above the candlestick high, with a stop-loss order placed below the candlestick low. The day after the order was placed, the RSI confirmed a breakout above the 50 level.
Here is another example of using intraday trading time frames:
Both trades hit their 1R target after ending their oversold conditions.
On the weekly chart, nothing else changes except that traders may use a trailing stop to lock in gains. An understanding of price structure and momentum will greatly assist traders using this and any other strategy.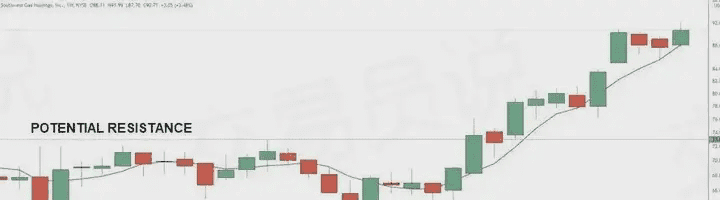
While a few candlesticks close above the 5-day SMA, we not only want to see the majority of candlesticks above it, but also want the candlesticks to show strength. Closes at or near highs are a sign of strength and worth noting. Also, keep in mind that there may be resistance areas in the path of price movement. Understanding how price behaves near resistance areas will help you successfully execute this strategy.
support or resistance
You shouldn't automatically enter a trade when a trigger occurs. Remember, this simply indicates that momentum was in your favor at that point in time. You still need to have basic chart reading skills.
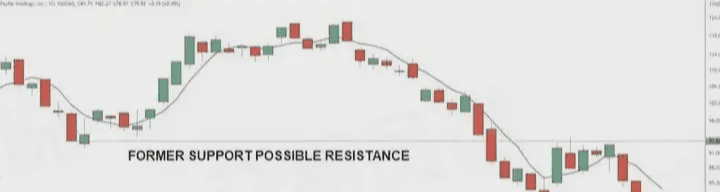
The chart shows that prices are rebounding from a decline. The 5-period RSI has been oversold for several days, and a strong momentum candlestick has broken through the 5-day SMA. This setup is at a level that has historically served as strong support and may act as resistance in the future.
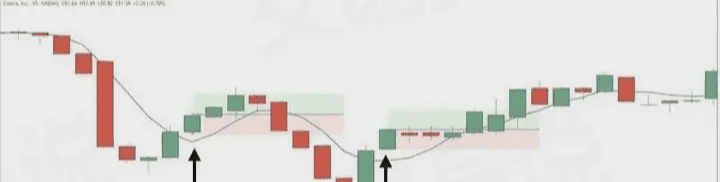
Chart Patterns
In this example, the price formed a double bottom pattern. Although a double bottom is not confirmed until the resistance is broken, it is still possible to take advantage of the breakout before the price breaks out, provided that the risk is controlled.
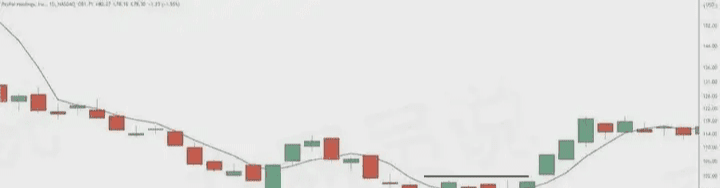
It is important to note that small range candlesticks are not always negative, depending on their shape. The candlestick with an arrow has a long lower shadow and closes just 0.01 below the high. The price reaches the 1R target or even higher.
Can you use chart patterns to help you decide when to take profits? If a double bottom forms, you can at least anticipate a challenge to the resistance zone, which is feasible when managing your trades. In this chart, the price did break through resistance, forming a trading range before reversing lower.
Trend line breakout
It is also a good idea to add a short-term trendline breakout as confirmation to the setup. In this example, we will be looking at a short trade after the price has risen for 28 trading days.
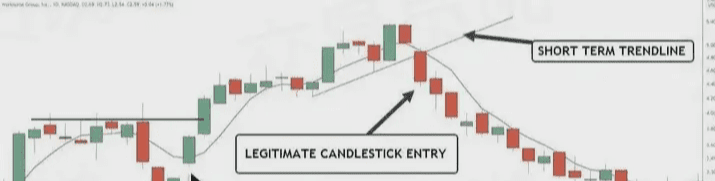
The price is overbought and has broken through the 5-day SMA and the trendline. There's nothing magical about trendlines, but they're great for showing changes in the tempo of price action. On the left, you can see another setup being triggered, with another strong candlestick breaking through resistance.
Incorporating trend lines into this strategy is a great technical addition, as is looking for significant chart patterns. Each trader can set their own profit targets based on their preferences. By studying hundreds of examples, you'll discover certain common characteristics among instruments with rising potential.
Using this strategy during a possible trend change will increase your chances of success. A trend change means that the instrument you are interested in is actually trending rather than sideways.
Similar to when prices fluctuate around a moving average, if the RSI fluctuates between above and below the 50 line, it indicates that the market is in a range-bound state and it is best to turn to other charts with clearer clarity.


