
Daily K-line trend analysis: Bitcoin reached 119,800, close to 120,000. The Sunday K-line closed with a weakening signal of bearish volume. The technical aspect shows that it was just 400 points short of reaching the daily EMA30 for a long entry opportunity. Ethereum rose straight up from 3505 by 400 points, rebounding from the 0.886 position. Technical analysis shows this rise is a continuation of wave 3 rather than the start of wave 5. Currently above EMA7 and has never fallen below the daily EMA7, continuing to rise along EMA7.#美国与欧盟达成关税协议
ETH awaits the completion of wave 3 for a high, planning a wave 4 pullback for long positions, targeting the fifth wave M top or standard position.
Previous Review: 114,200 long entry point given but missed by 400 points, missed the opportunity to enter. The final rebound point of 3505 was not given, missing a straight rebound opportunity of 400 points.
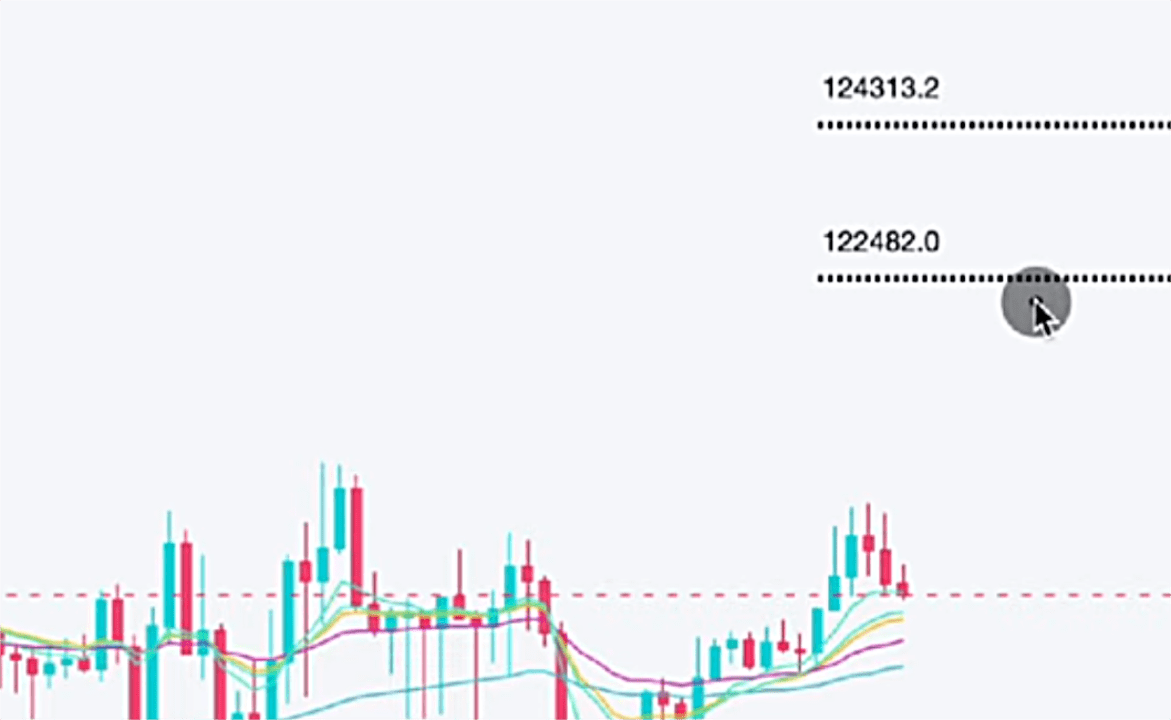
BTC Resistance Level 1: 122,400 (bearish shark pattern, first harmonic resistance level),
BTC Resistance Level 2: 124,300 (2BM top 1.13 false breakout position, second resistance level),
Extreme resistance level: 135,500 (weekly level 100% position of wave 5, best upward scenario) currently does not provide a support level (divergence upward phase shape support level is unclear, short-term shape has not formed)$BTC
ETH Resistance Level 1: 4000 (first target of potential high in wave 3),
ETH Resistance Level 2: 4100 (second target of potential high in wave 3),
ETH Resistance Level 3: 4500 (third target of potential high in wave 3),
Short-term pressure: 3953 (1.272 extension position, about to touch with high risk)$ETH
ETH Support Level: 0.382 position of wave 4 pullback (waiting for layout opportunities after wave 3 completion)
For more detailed point analysis, please watch today's market analysis video, which contains detailed explanations. Follow A-Leng to study candlesticks, and we will meet at the peak together! Pay attention to avoid getting lost, and get daily updates on the latest point interpretations!