📌 What Are Technical Indicators in Depth?
Technical indicators are mathematical tools derived from price data (open, close, high, low) and trading volume. They don’t predict price directly, but help you interpret what the market is doing now, reducing emotional decisions and increasing logical ones.
> ❗ Indicators don’t guarantee success — they increase probability.
🔍 Main Categories of Indicators:
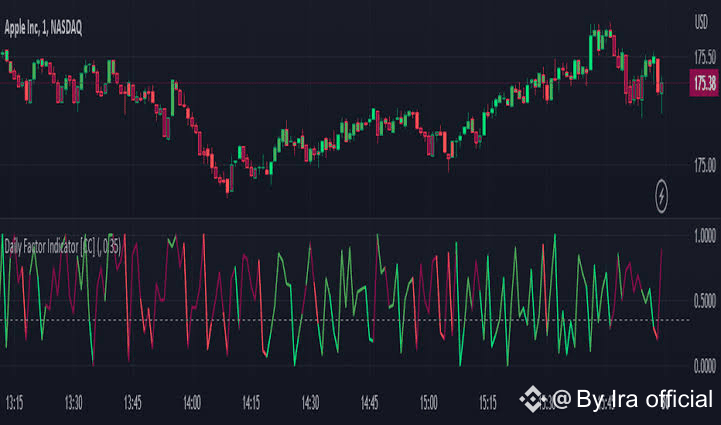
1️⃣ Momentum Indicators:
These measure the strength and speed of price movements. They help detect overbought or oversold conditions.
🔸 RSI (Relative Strength Index):
Range: 0 to 100.
Above 70 ➜ Overbought.
Below 30 ➜ Oversold.
⚠️ Don’t trade just because RSI hits 70 or 30 — always check price context.
🔸 Stochastic Oscillator:
Consists of two lines (K and D).
Crossovers near the 80/20 levels signal potential entries or exits.
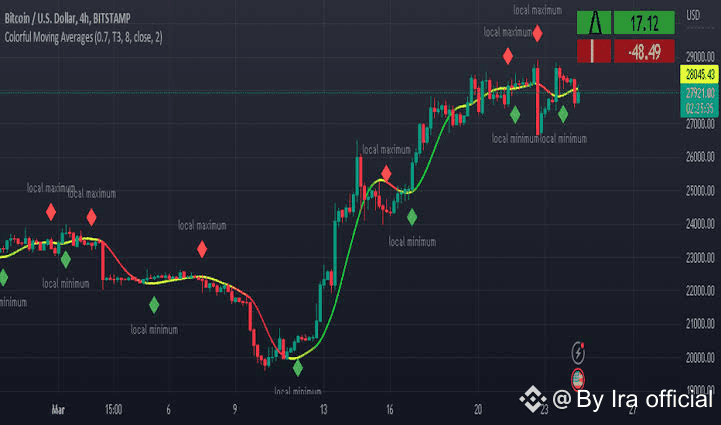
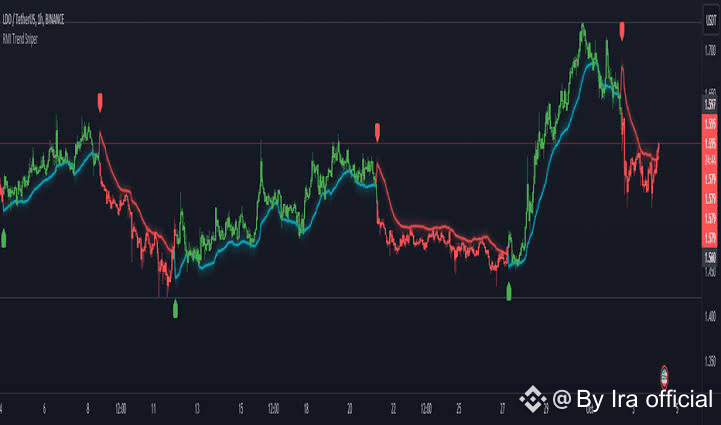
2️⃣ Trend Indicators:
These help identify the direction of the market (uptrend, downtrend, sideways).
🔸 Moving Averages:
SMA: Simple Moving Average.
EMA: Exponential Moving Average (more responsive).
🔁 Golden Cross/Death Cross.
EMA 50 crossing above EMA 200 ➜ Bullish.
EMA 50 crossing below EMA 200 ➜ Bearish.
🔸 MACD (Moving Average Convergence Divergence):
Shows momentum and trend direction.
Key signals come from crossovers and histogram changes.
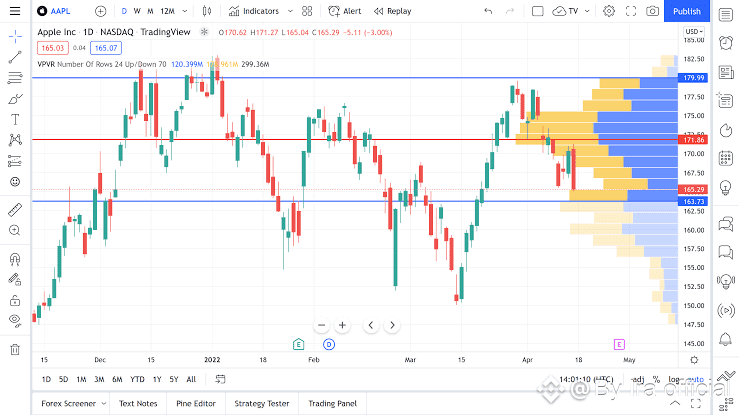
3️⃣ Volume Indicators:
Volume confirms the strength or weakness of a move.
🔸 OBV (On-Balance Volume):
Price up + Volume up ➜ Strong trend.
Price up + Volume down ➜ Weak trend.
4️⃣ Volatility Indicators:
They show how much price is moving within a certain period.
🔸 Bollinger Bands:
3 lines: middle MA, upper and lower bands.
Price touching upper band ➜ Possible pullback.
Bollinger Squeeze ➜ Breakout coming soon.
🔸 ATR (Average True Range):
Measures market volatility.
High ATR ➜ Riskier market.
🧠 Smart Indicator Combination Strategy:
👉 Don’t stack similar indicators (like RSI + Stochastic).
✅ Use complementary indicators:
Trend + Momentum + Volatility.
Example Setup:
EMA 50 & EMA 200 for trend.
RSI for momentum.
Bollinger Bands for volatility.
🔎 Entry Signal:
Price above EMAs.
RSI in healthy range (50–70).
Price bouncing from lower Bollinger Band.
OBV increasing ➜ Volume confirmation.
📈 Decision: Long entry with stop-loss below recent swing low.
⚠️ Common Mistakes to Avoid:
❌ Relying on one indicator only.
❌ Entering based on a single signal.
✅ Use indicators with price action confirmation.
✅ Always backtest your strategy.
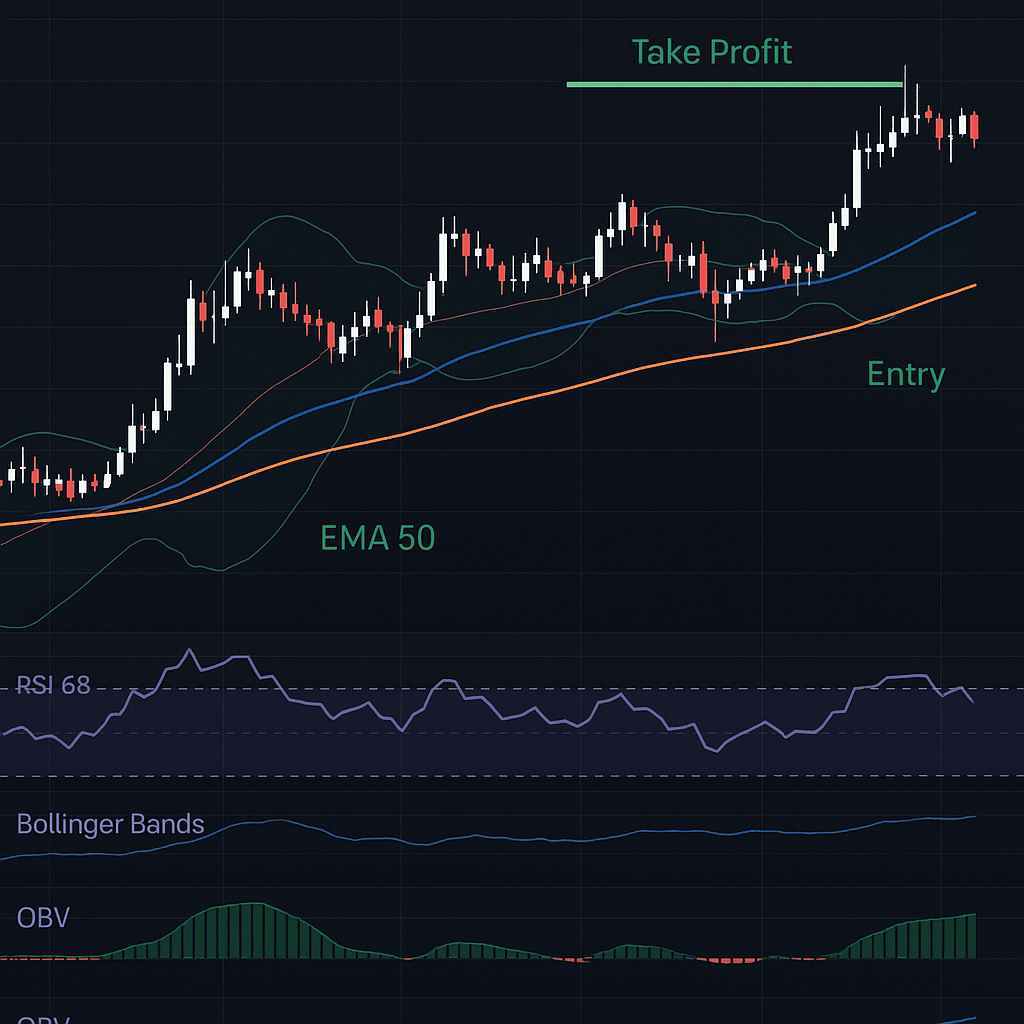
🔄 BTC Practical Example (Advanced):
Tools:
EMA 50, EMA 200.
RSI.
Bollinger Bands.
OBV.
Analysis:
Price is above both EMAs (uptrend).
RSI at 68 (strong momentum).
Price recently bounced from lower Bollinger Band.
OBV is rising.
✅ Setup: Long position with defined stop-loss and target at upper Bollinger Band.
✅ Final Tips:
Stick to 2–3 reliable indicators.
Know what each one measures.
Test before using in real trades.
Let indicators support your strategy — not replace it.
💬 Stay consistent, stay focused — mastering indicators takes time, not luck.
🚀 If you’ve been following this journey, you’re already ahead of most beginners!
📚 The journey continues — follow for more lessons and practical strategies.
#CryptoEducation💡🚀 #TechnicalAnalysis #tradingtips #cryptotrading #Indicators
