This is a daily analysis of the top tokens with CME futures contracts.
Bitcoin $BTC : Continued price range fluctuation with MACD indicator hints at a downward trend
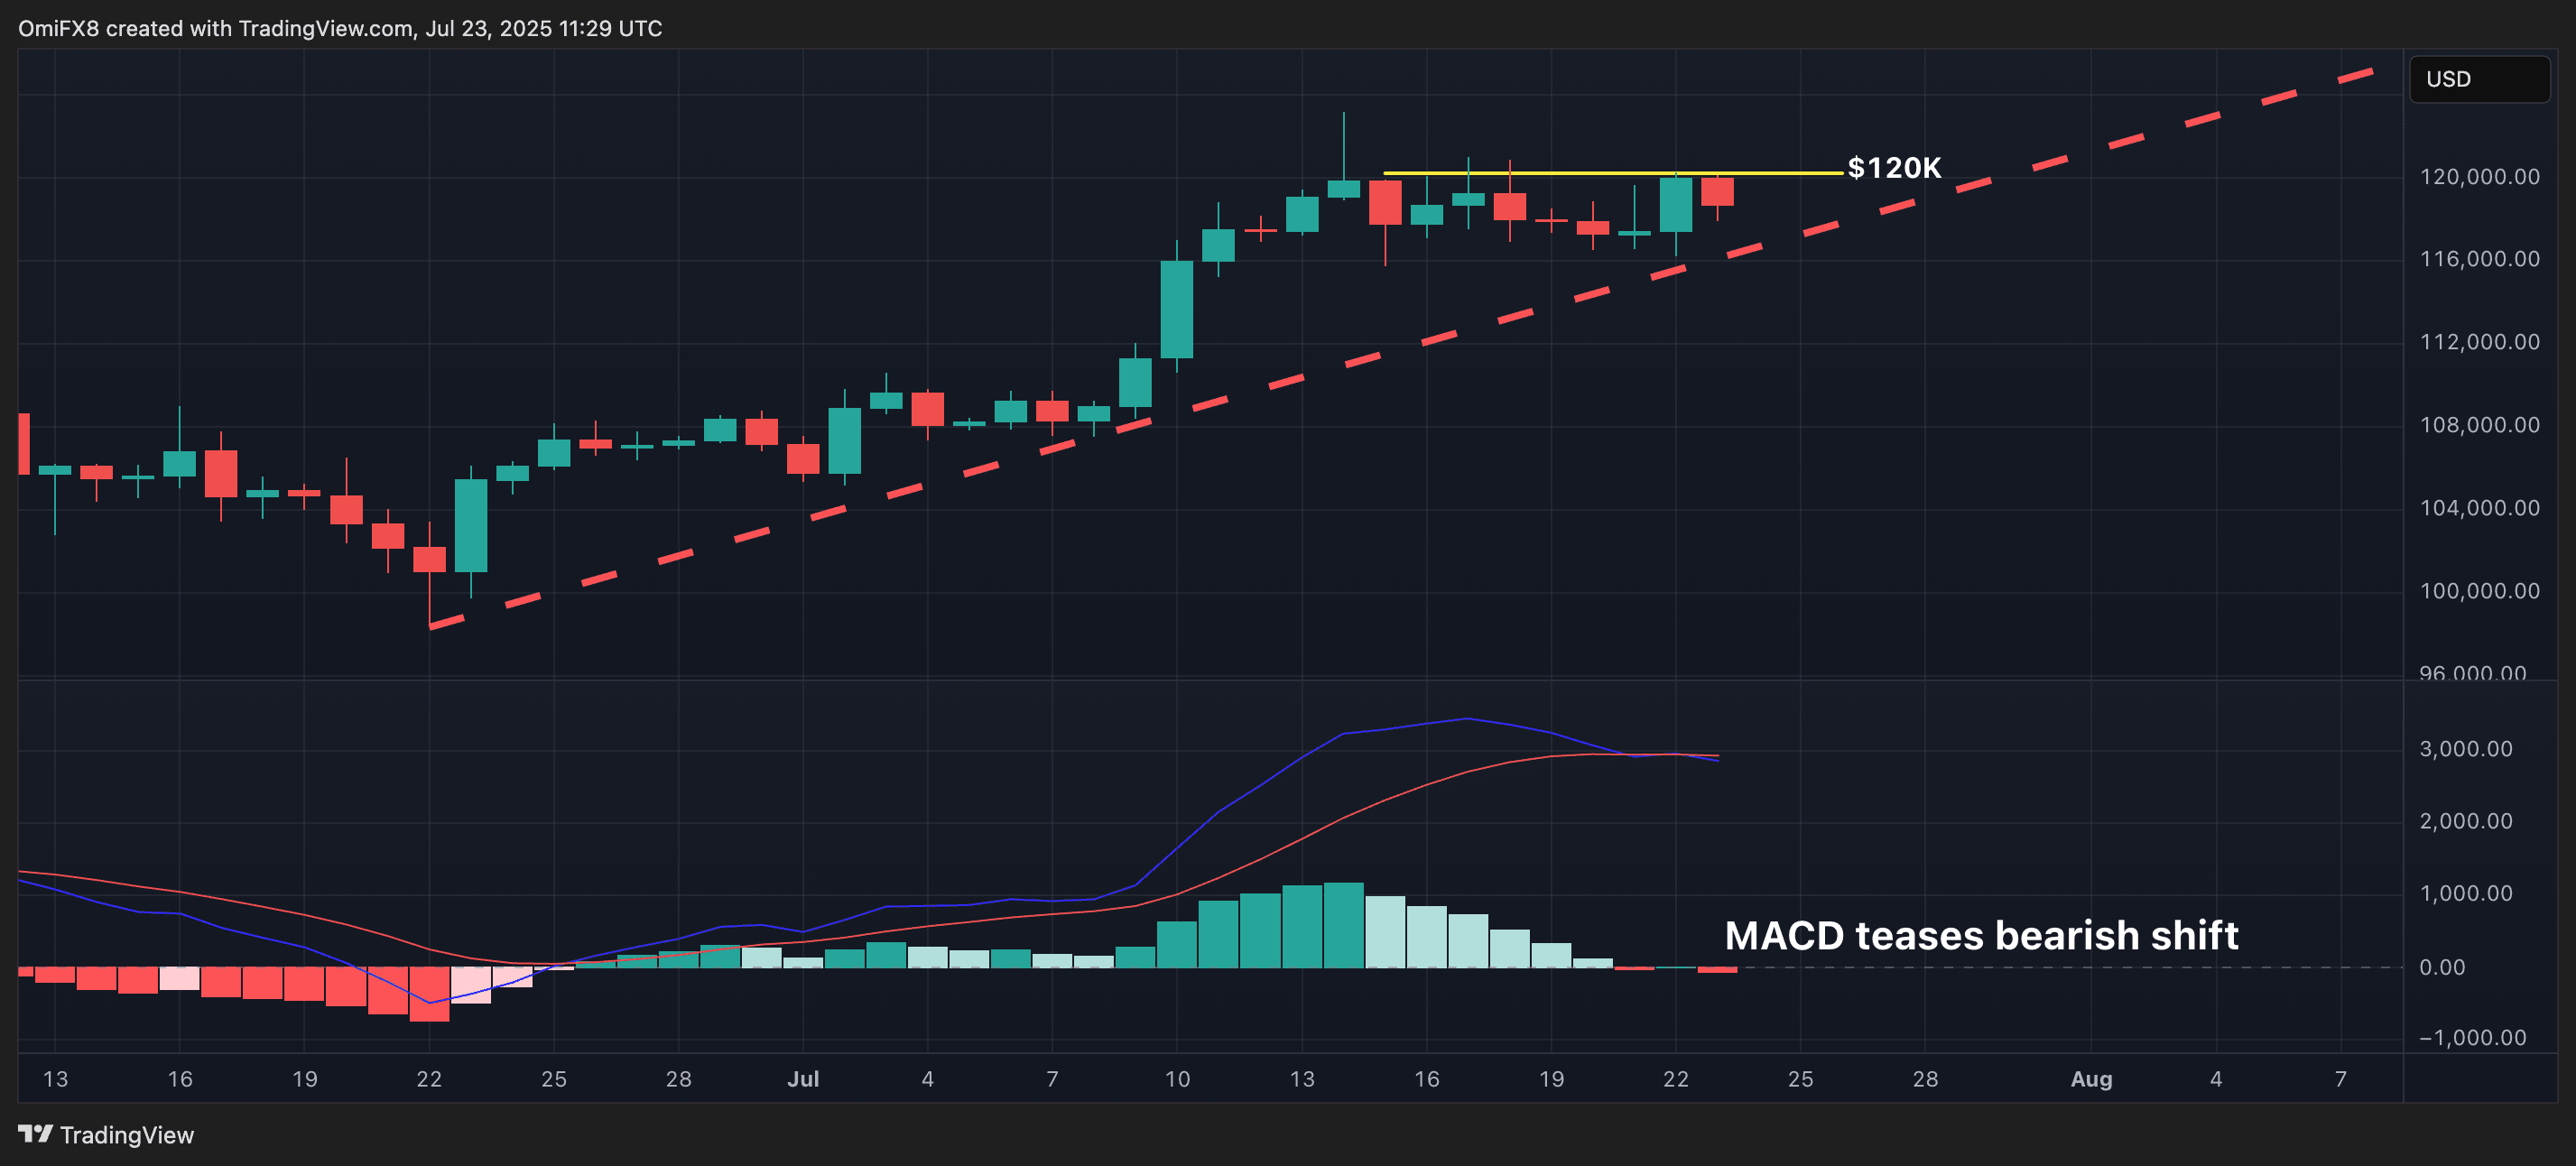
Bitcoin reached its all-time high above $123,000 on July 14 before entering a period of consolidation. Since then, prices have remained within a defined price range between the resistance level of $120,000 and the support level of $116,000, with bulls failing once again to establish themselves above this level over the past 24 hours. This volatile trading, along with the flattening of the daily moving averages and the daily MACD indicating a bearish shift, has increased the risk of a pullback. However, the upward trend line from June's lows remains intact, keeping hopes alive for a bullish resolution that could lead to new record highs.
BTC's daily chart
#البيتكوين shows weak momentum stabilizing below the resistance level of $120,000, with the MACD histogram indicating a potential bearish shift.
Resistance: $120,000, $123,181.
Support: $116,000, $115,739, $111,965.
$XRP : Threatened upward trend in July
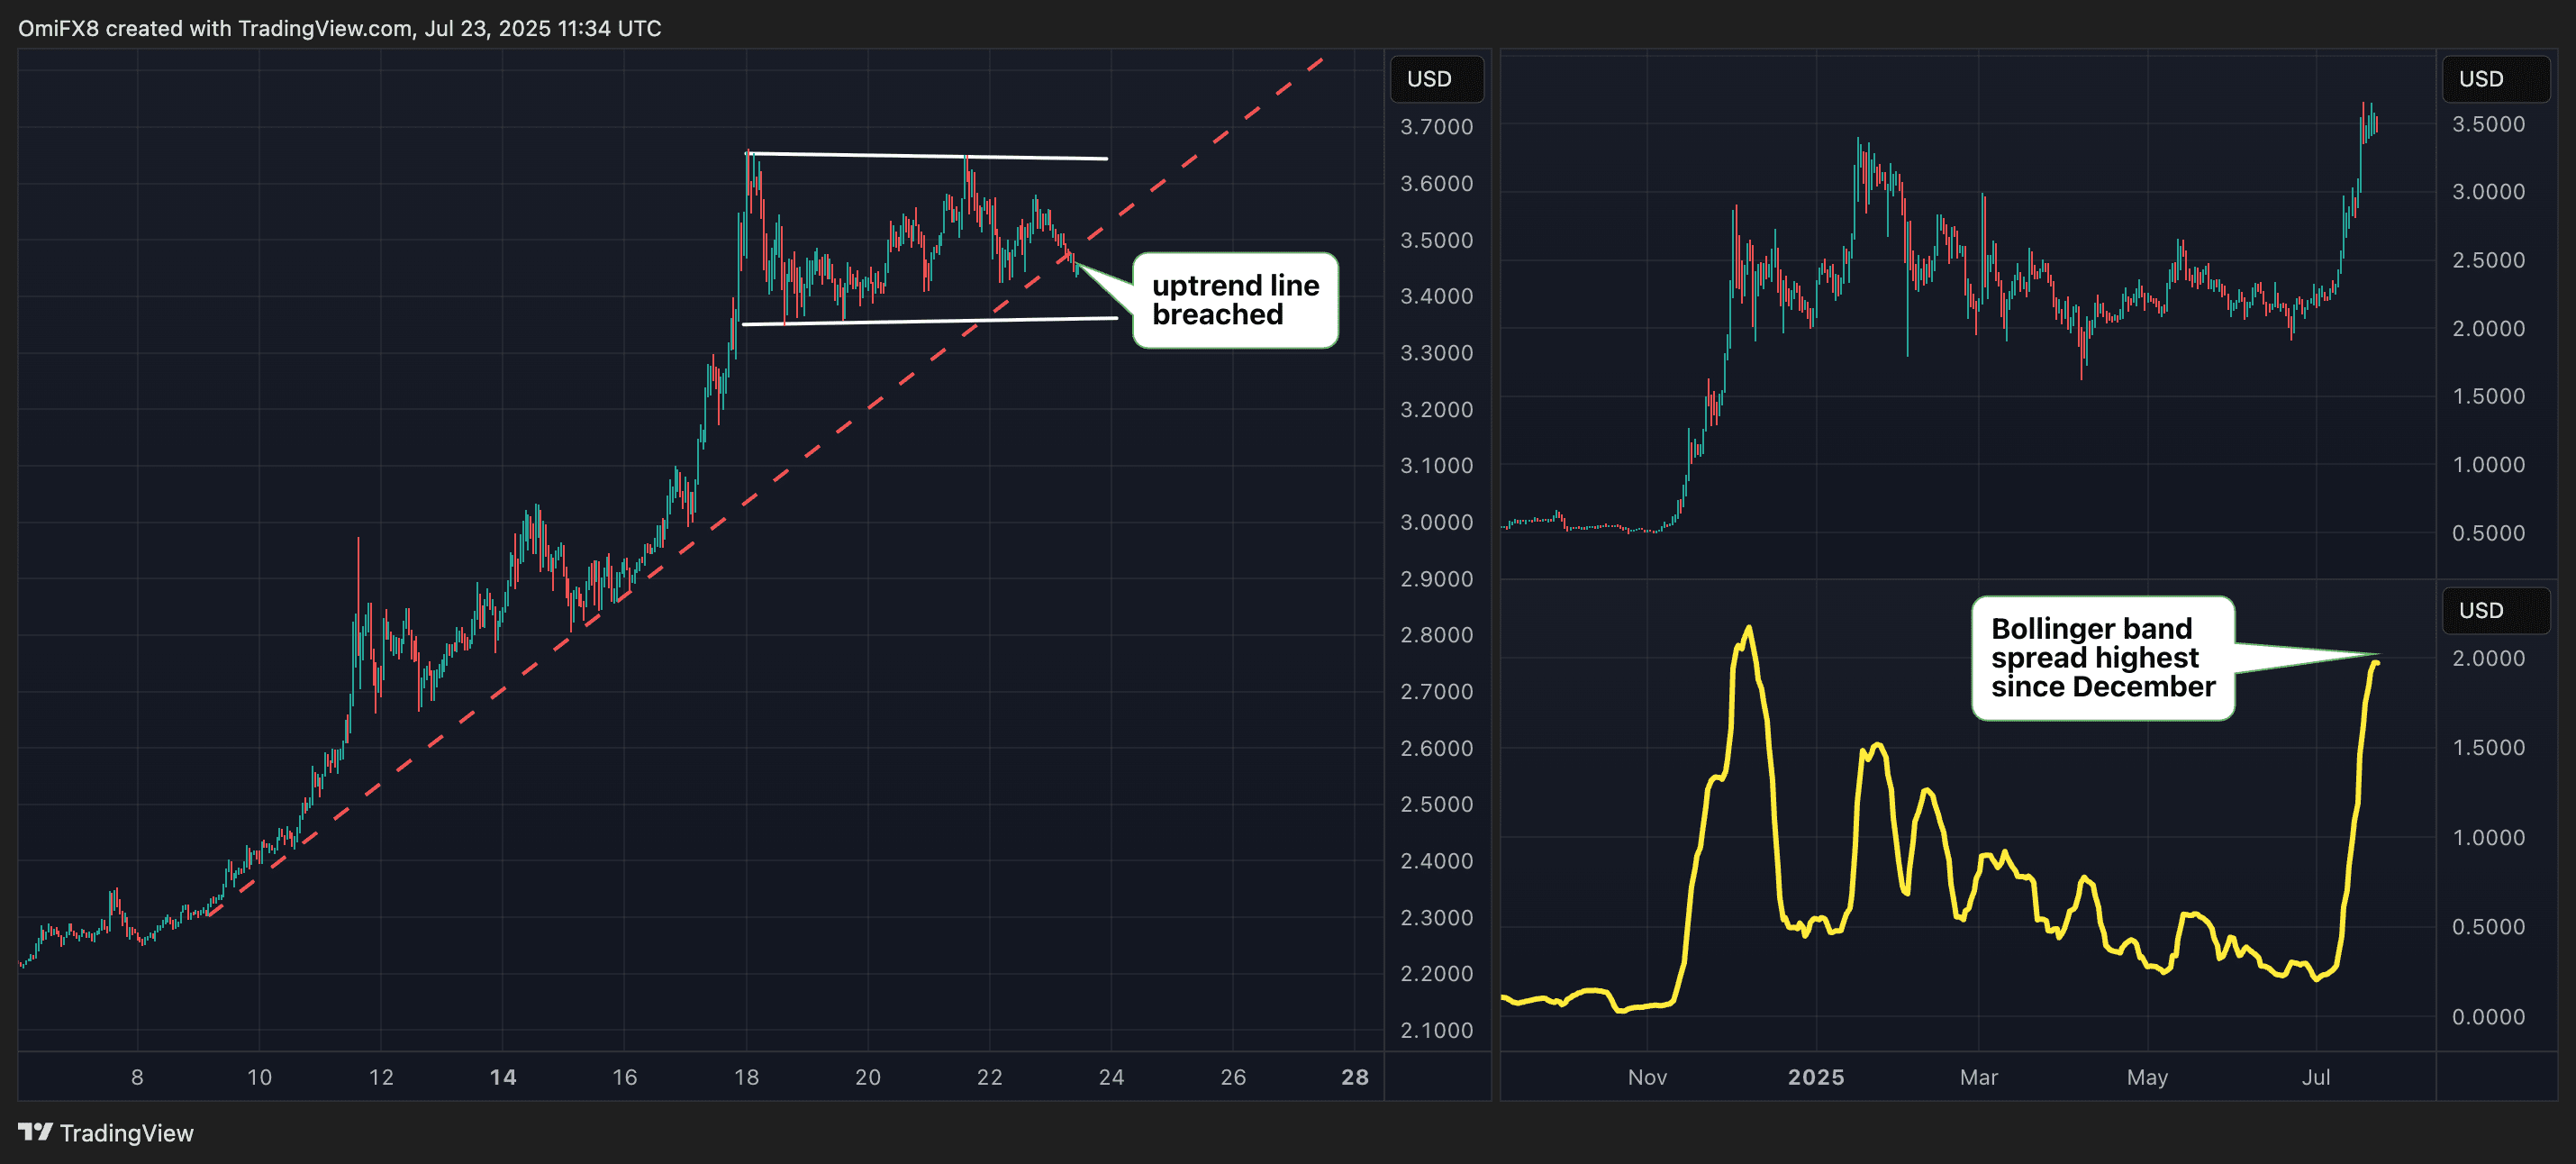
Like Bitcoin, XRP has lacked a clear direction recently, trading volatilely between $3.35 and $3.65. What has changed in the last 24 hours is that the trend line representing the price rise from $2.20 to its record highs has been breached, reinforcing the likelihood of a pullback in the recent trading range. Furthermore, the gap between the Bollinger Bands has widened to levels that warned of a December correction. The Bollinger Bands are volatility ranges that are positioned two standard deviations above and below the simple moving average of the asset over twenty days.
If the minimum of the last range does not hold, there may be a risk of a prolonged drop.
XRP
While the Bollinger Bands spread at a multi-year high indicates sharp volatility and an upcoming rest period, breaking the upward trend line calls for caution from traders.
Resistance: $3.65, $4.00
Support: $3.35, $3.00, $2.65
Ethereum: Consolidation is likely with the widening of the Bollinger Bands
The sharp rise of Ethereum from its June lows near $2,200 halted this week as prices fell to $3,600 from a peak of $3,850. Short-term consolidation in a wide range seems likely, as the Bollinger Bands on the daily chart have widened to their highest level since April-May 2021. This widening is a traditional technical signal that the market has experienced a period of extreme volatility and strong directional movement, suggesting it may now be on the verge of entering a range or 'rest' period before its next major move. This view is supported by the 14-day relative strength index, which has peaked in what is known as the overbought zone or above 70.
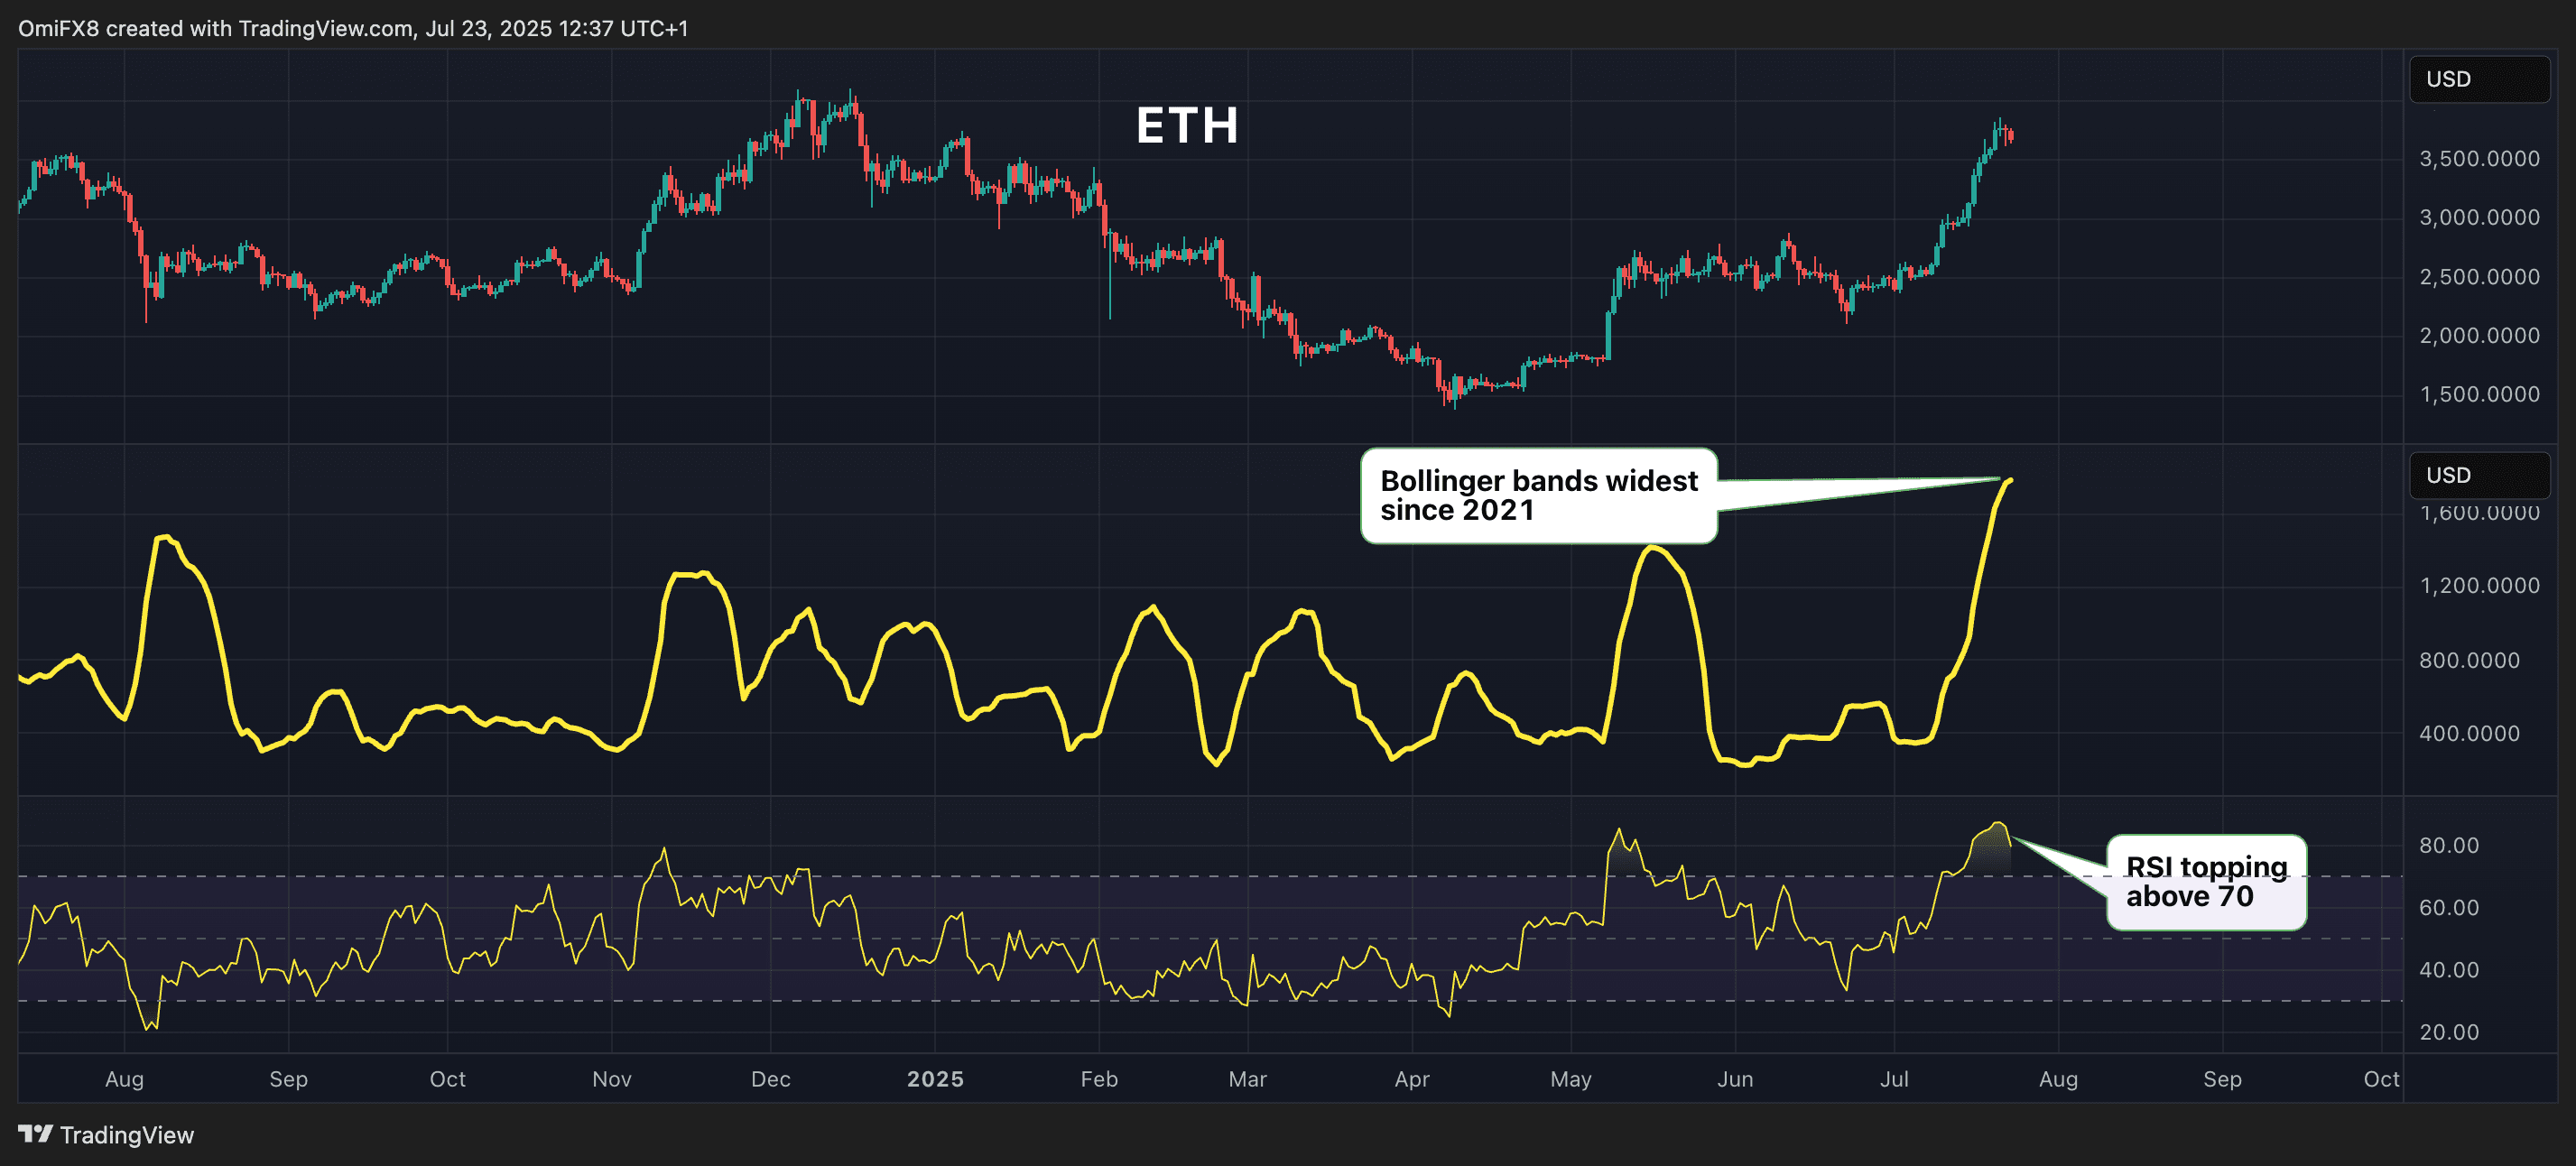
$ETH The rise in Ethereum's price pushed the relative strength index (RSI) above 70 and widened the Bollinger Bands to their highest level since 2021, both indicating an extremely overbought market.
Resistance: $4000, $4109, $4382.
Support: $3480, $3081, $2879.
Current price: trending north
The current price of Solana has dropped below $200 as of this writing. However, the upward potential still exists, as indicated by both the daily moving averages and the upward chart. The Bollinger Bands have widened to their highest level since the first quarter, thus ending a prolonged low volatility wave, indicating an upward trend. Additionally, the 50-day simple moving average (SMA) appears to be on track to cross above the 200-day simple moving average in what is known as a golden cross. All this suggests that SOL may exploit the upper end of the ascending channel with a potential move to $215 and above.
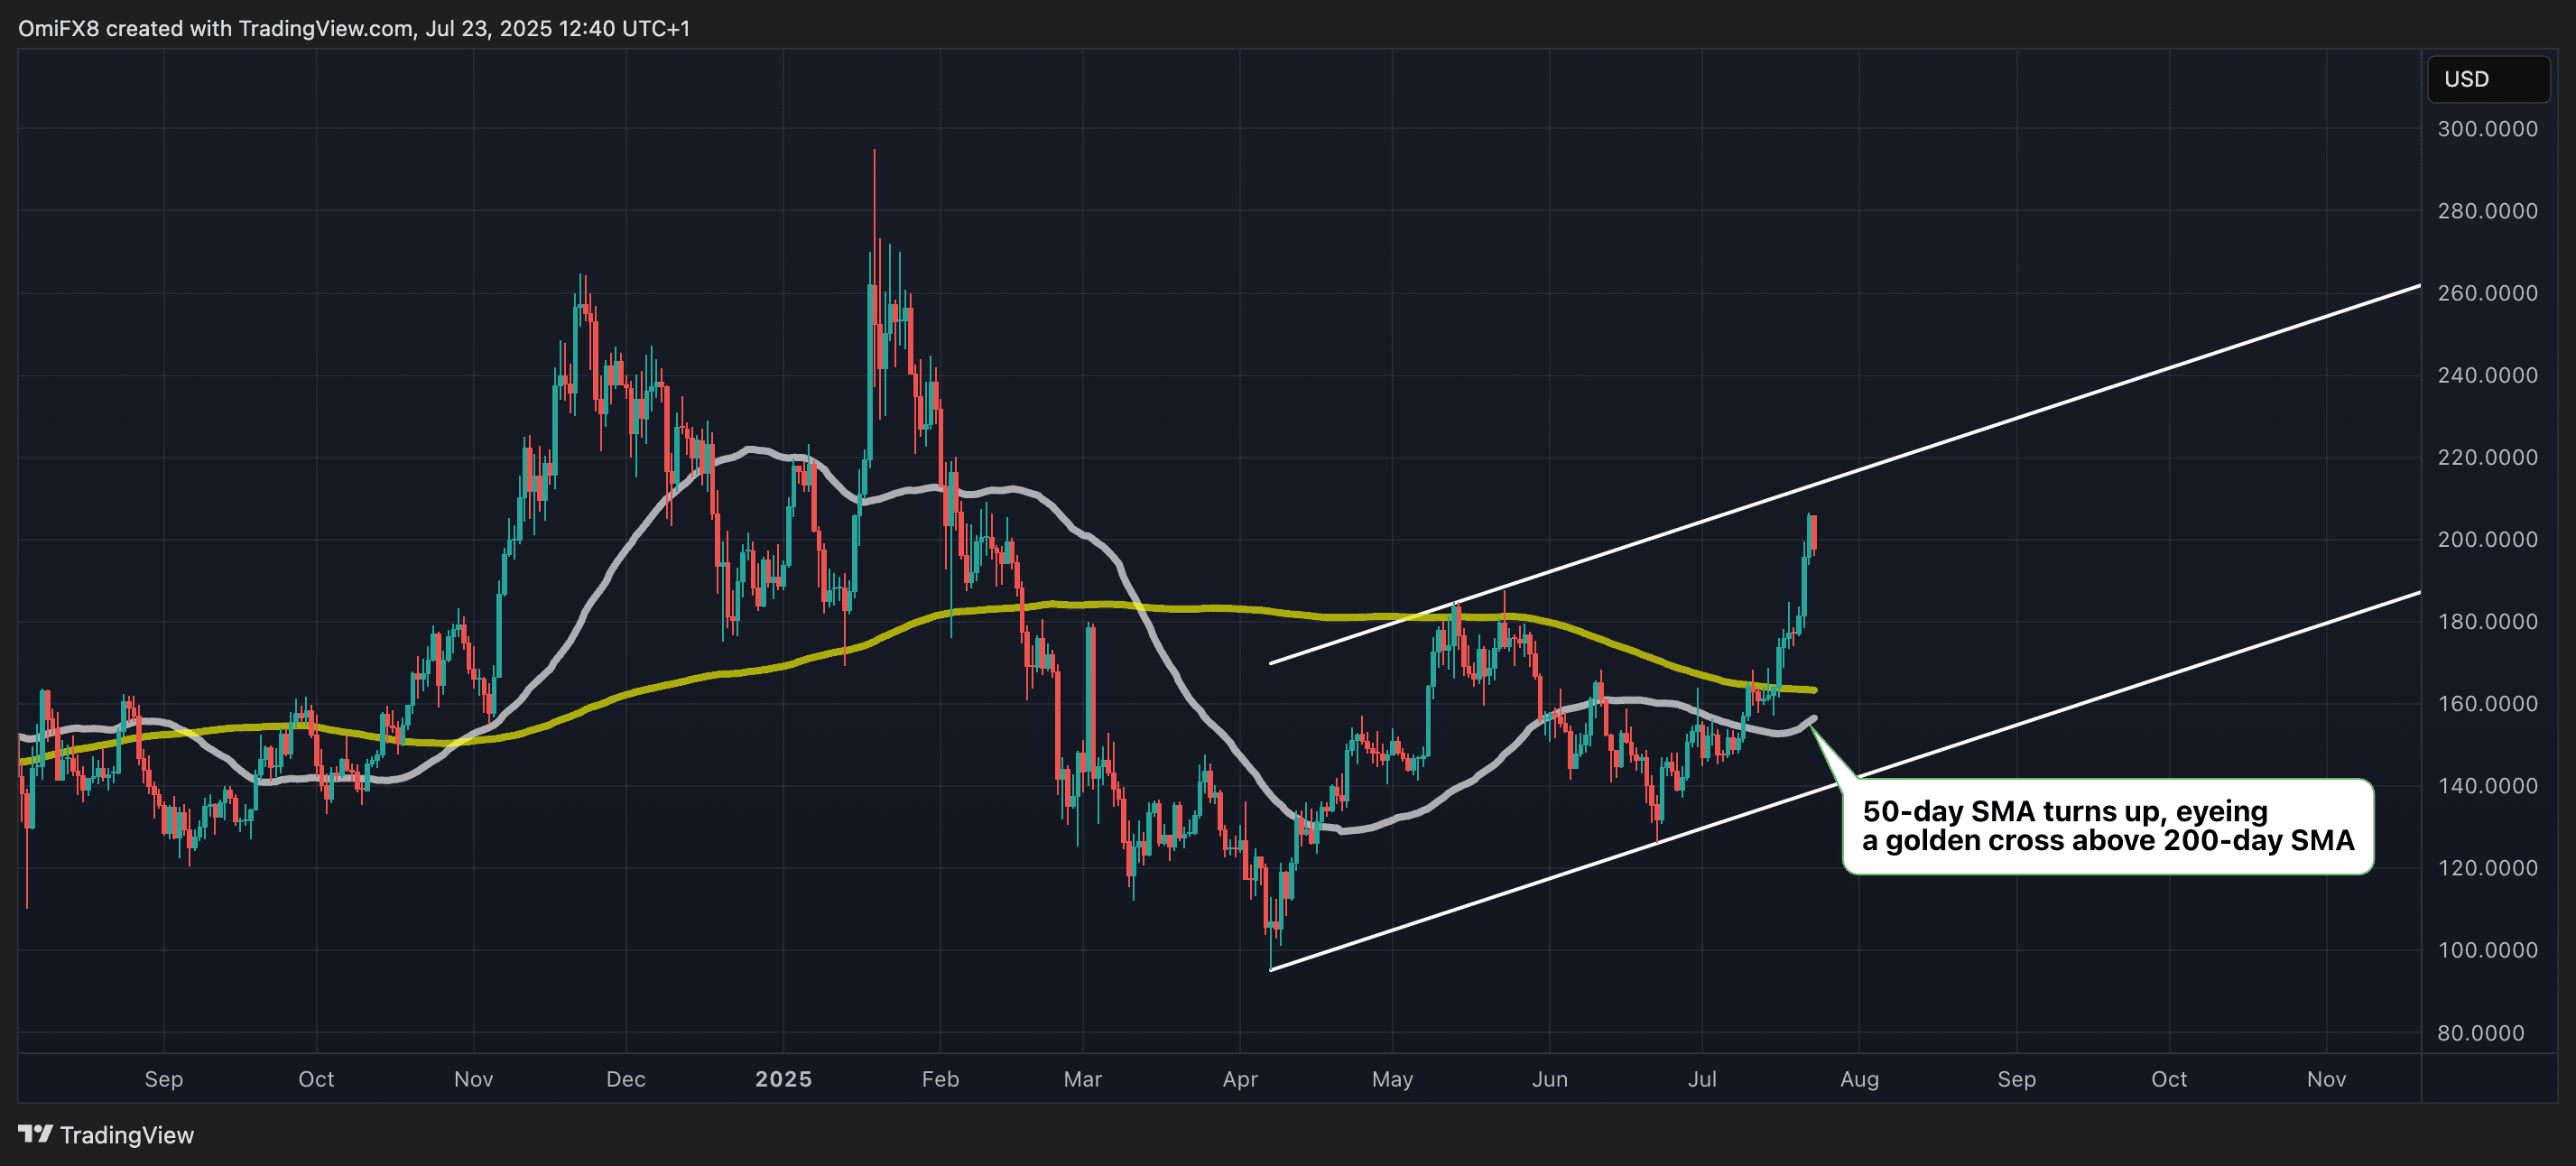
#SOL Price action is confined within a clearly defined ascending channel, indicating that the rise from April's lows is a strong and consistent upward trend. The recent breakout of the upper half of this channel reinforces the upward momentum.
Resistance: $218, $252-264.
Support: $187-185, $163 (50-day simple moving average), $145.


