
After weeks of low volatility, the price of Shiba Inu has surged back. The recent bullish surge has attracted attention, but currently, the price is hitting a strong resistance level. This article analyzes the chart, what traders should expect next, and the potential for a rise or fall.
Shiba Inu Price Prediction: Does SHIB's Derivative Activity Signal a Major Step Forward?
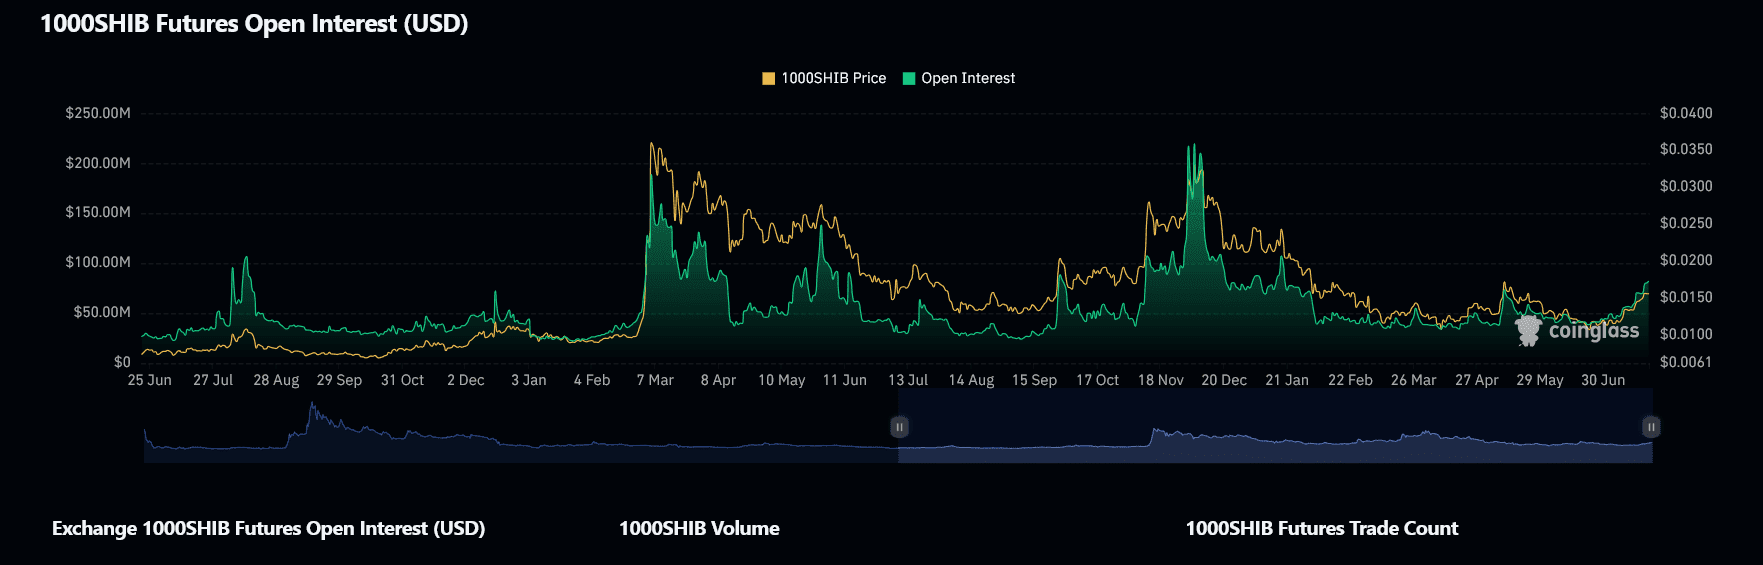
The Shiba Inu derivatives market is booming, and it could be an important clue for what lies ahead. The open interest of 1000SHIB futures contracts on Binance has increased by over 39% this month, reaching 5.11 billion SHIB.
This is the highest level since early December. The strong increase in open positions signals new capital flowing into the market, possibly due to traders shifting from Bitcoin to more speculative altcoins like SHIB.
These futures contracts offer leverage up to 25 times, allowing traders to control large positions with relatively small capital. The issue is that such high-risk levels often lead to strong volatility.
With increased leverage, even small price changes can trigger liquidations, as exchanges are forced to close positions. This can amplify price volatility in both directions.
On-chain signals are also showing a bullish trend. Over 100 million SHIB tokens have been burned in just one session, with the burn rate skyrocketing over 3600%. The stock of SHIB on exchanges has dropped to a year-low of $1.14 billion. This reduction in available supply often limits selling pressure, allowing prices to rise during bullish phases.
Trading volume also tells a story. The spike to 1.394 trillion tokens traded in the early stages of the rally has surpassed the 24-hour average. Since then, trading volume has gradually decreased, but not in a negative direction.
Instead, we are witnessing consolidation with lower trading volumes, which is often a sign of accumulation. At the same time, SHIB's price has formed a series of higher lows, indicating that buyers are gradually entering with more confidence.
What Does the Chart Currently Indicate?
The sudden spike in SHIB derivatives activity is not just noise in the futures market. It also directly impacts the spot price as leveraged trading often dominates short-term price volatility.
As open interest volume rapidly increases, as seen this month, it reflects traders' higher expectations and increases the likelihood of greater volatility, faster. This creates a feedback loop. As SHIB's price rises higher, more traders rush in with leverage, adding further momentum to the price.
Conversely, if the price hovers near the resistance level, it can trigger mass liquidations, accelerating the downward momentum. In the case of SHIB, the strong increase in future risk ratio, combined with declining supply on exchanges and skyrocketing burn rates, creates ideal conditions for a breakout or collapse.
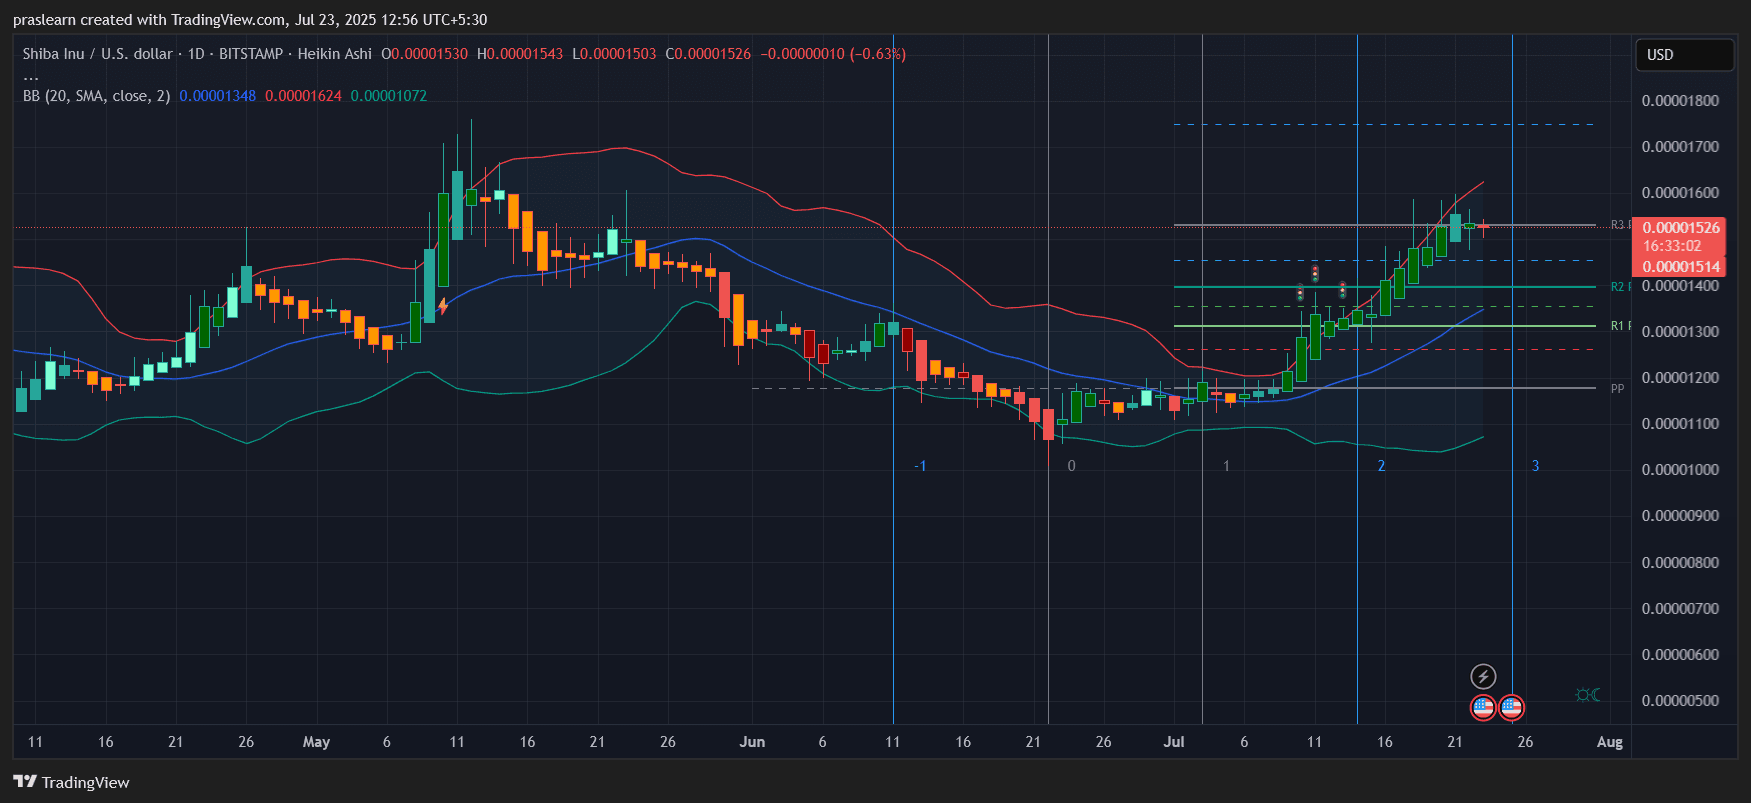
The correlation between the accumulation of derivative instruments and the spot price volatility of Shiba Inu is why SHIB traders need to pay close attention to both markets. This is the daily Heikin Ashi chart with Bollinger Bands, pivot levels, and Fibonacci retracement levels drawn.
SHIB has broken above the baseline of 0.00001100 and increased nearly 40%, entering the upper Bollinger Band. The price is currently at 0.00001526, right at the important resistance level including the pivot point R3. Historically, this zone is very difficult to break through on the first attempt.
Looking at the Fibonacci retracement from the swing bottom, the 0.618 level is at 0.00001370. This level coincides with R1, indicating it could be a solid retracement zone if the current uptrend stalls. The 20-day SMA is trending upwards near 0.00001348, reinforcing the support zone just below.
Pros and Cons:
If SHIB breaks and holds above 0.00001560, there is a likelihood of moving to the range of 0.00001700 to 0.00001800. This figure corresponds to an increase of about 18% from the current level.
Conversely, if the breakout fails, the price may revert to the support zone of 0.00001370 to 0.00001300. This equates to a decrease of 15%.
In terms of risk/reward ratio, you are looking at a ratio of about 1:1.2 leaning towards upside. Not too large, but worth monitoring if trading volume is confirmed.
Shiba Inu Price Prediction
Shiba Inu is under pressure. A strong breakout above the 0.00001560 level could trigger a new bullish phase. If it cannot break convincingly, the price may short-term correct to 0.00001370.
Traders should be cautious. Monitor confirming volume. Avoid entering trades when in doubt. Let the price show the way first. If the price breaks, that's the opportunity. If not, patience will prevail.


