#Pi Coin stabilized around $0.47 after the launch of the fiat gateway Buy Pi. On the news, the cryptocurrency price rose to $0.52. This is the first significant jump in recent days.
Two technical signals on a shorter time frame suggest that this may not just be a temporary bounce.
The trend is gaining strength again. There is a trigger that could boost the price by another 40%.
========/
The strength of the trend is returning, but confirmation is needed:
The average directional index (ADX) on the 4-hour chart is again above 30. This indicates that the bullish price movement has received support. These are not just random fluctuations.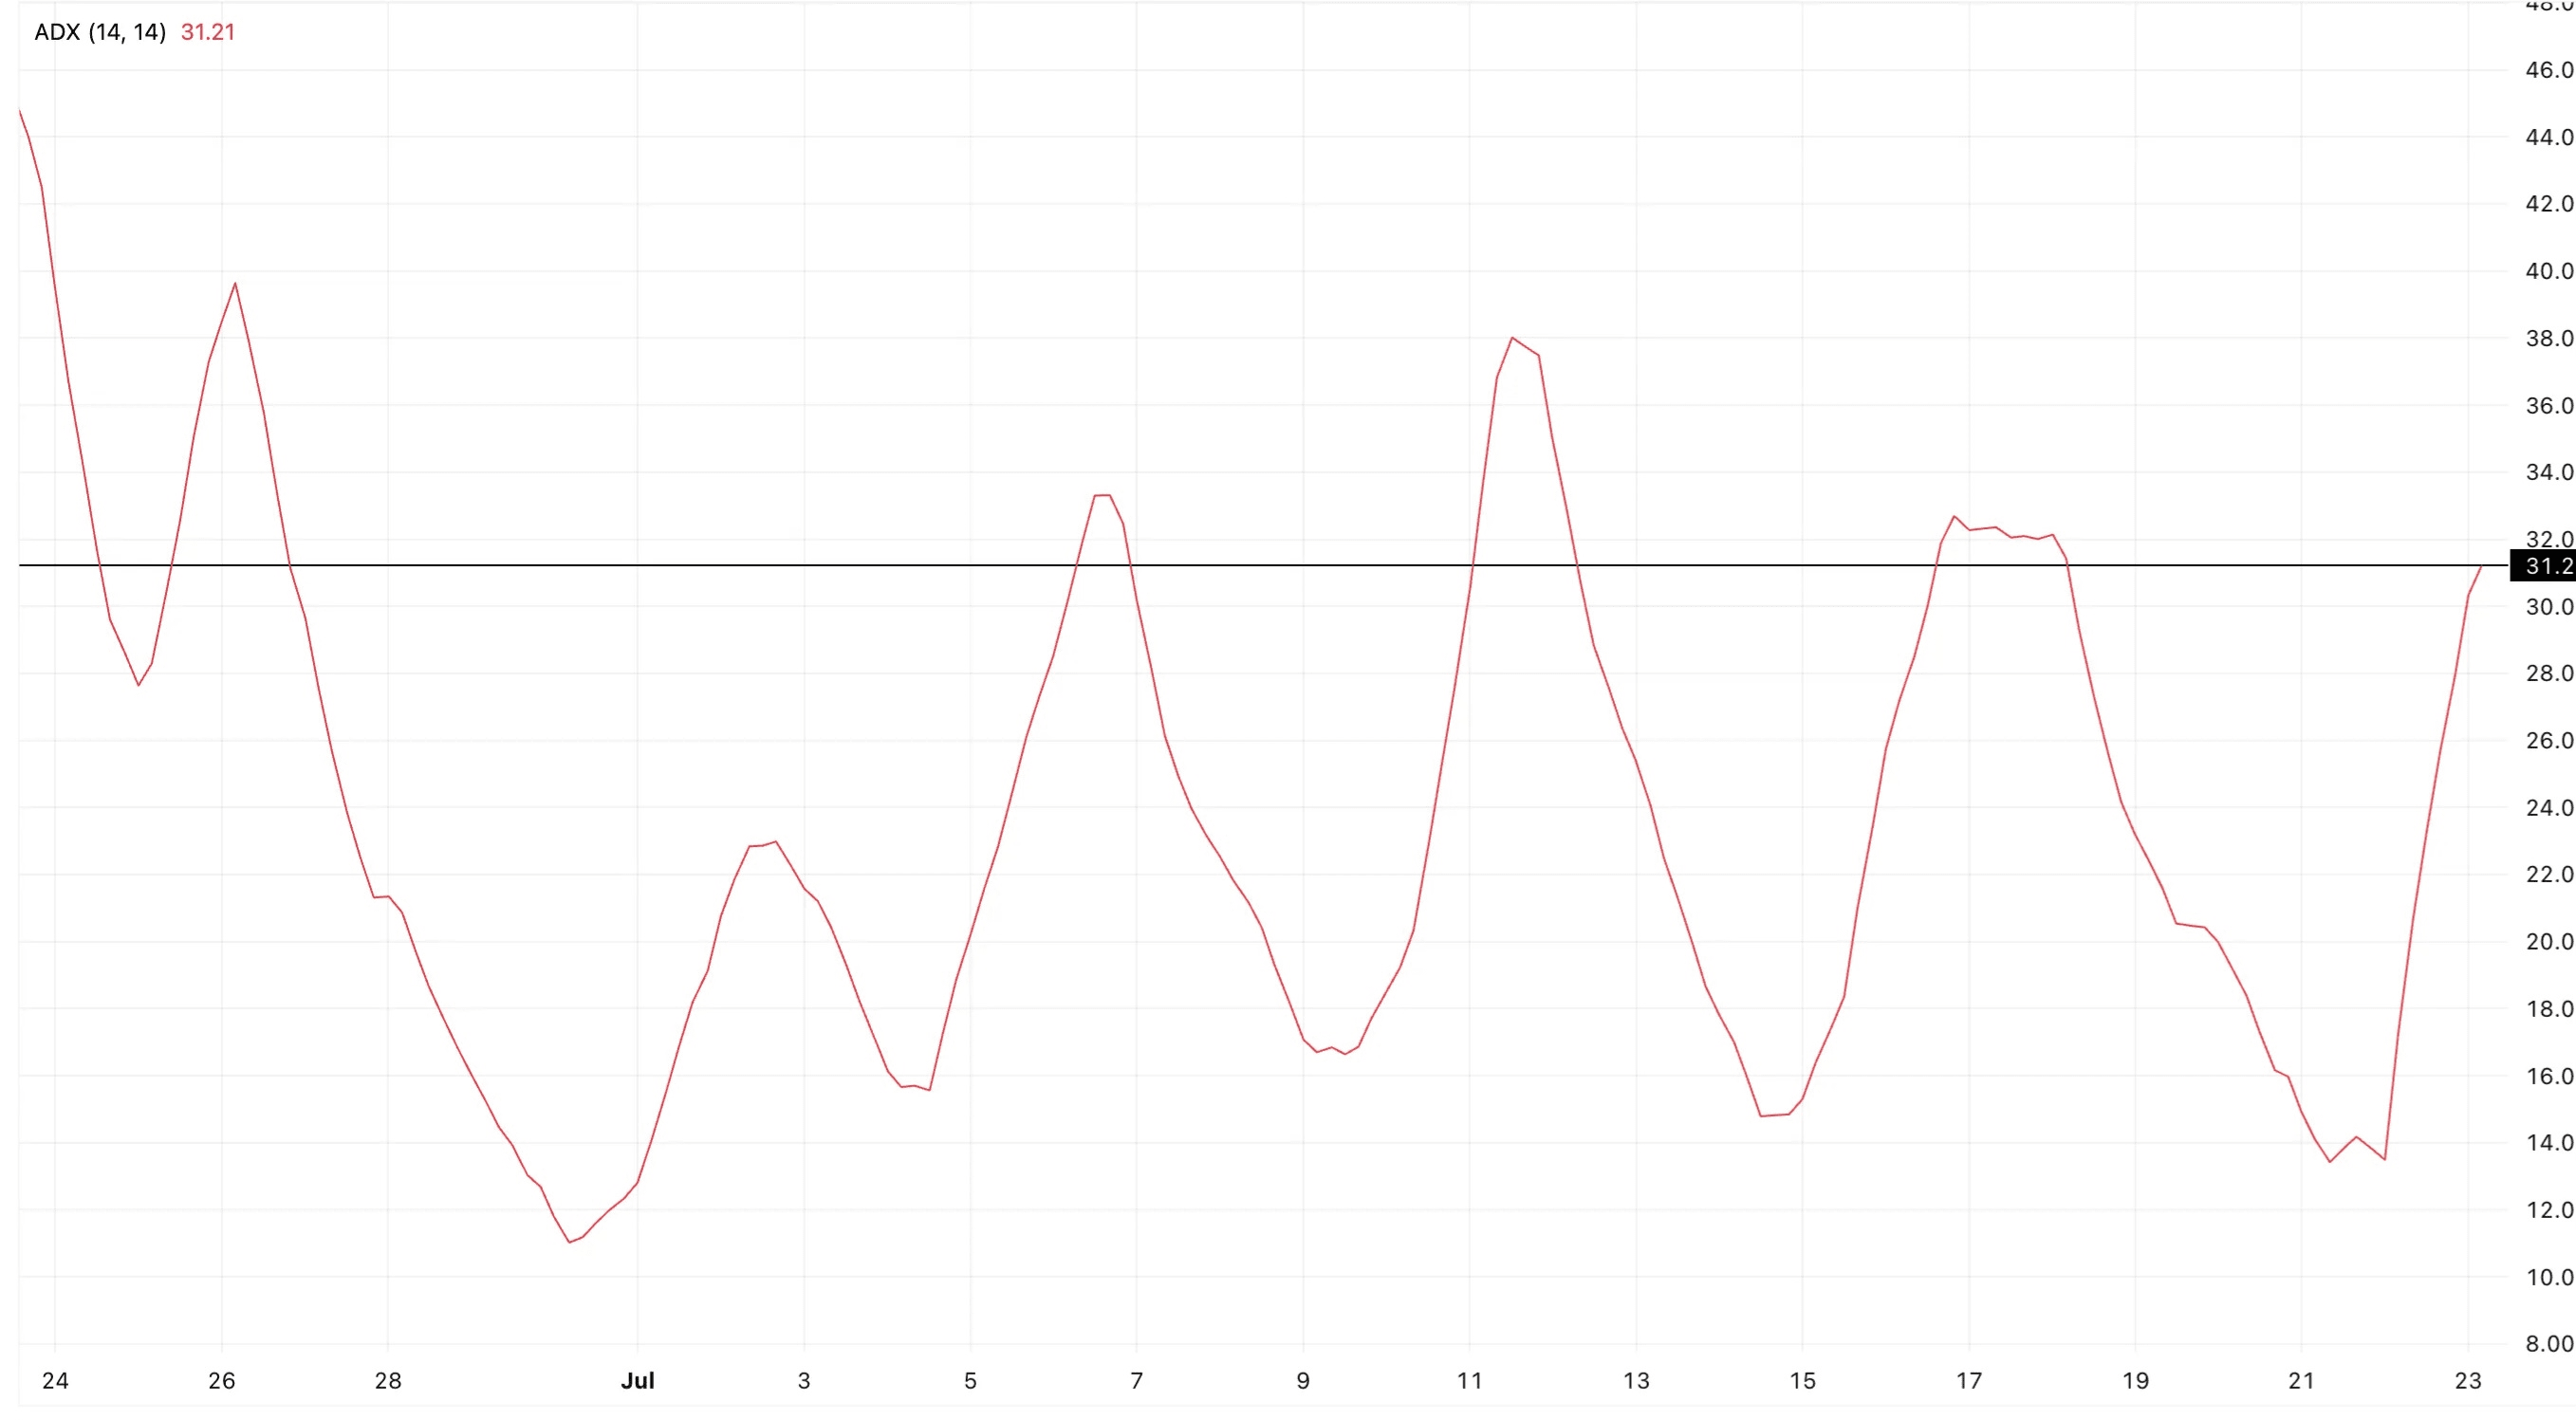
However, the current peak of ADX is below the previous one. The positive trend of Pi Coin is evident, but it is not yet stronger than before.
A new ADX peak or maintaining the ADX above the mid-20s will strengthen confidence.
A 4-hour overview is important here, as the jump on Tuesday occurred during the day; signals appear here earlier than on the daily chart.
ADX measures the strength of the trend (from 0 to 100) but does not indicate direction, so it must be analyzed together with price movement.
====≈=====
The market is waiting for the EMA trigger:
The 20-period exponential moving average (EMA) has already crossed the 50-period EMA, coinciding with the price increase from $0.45 to $0.52.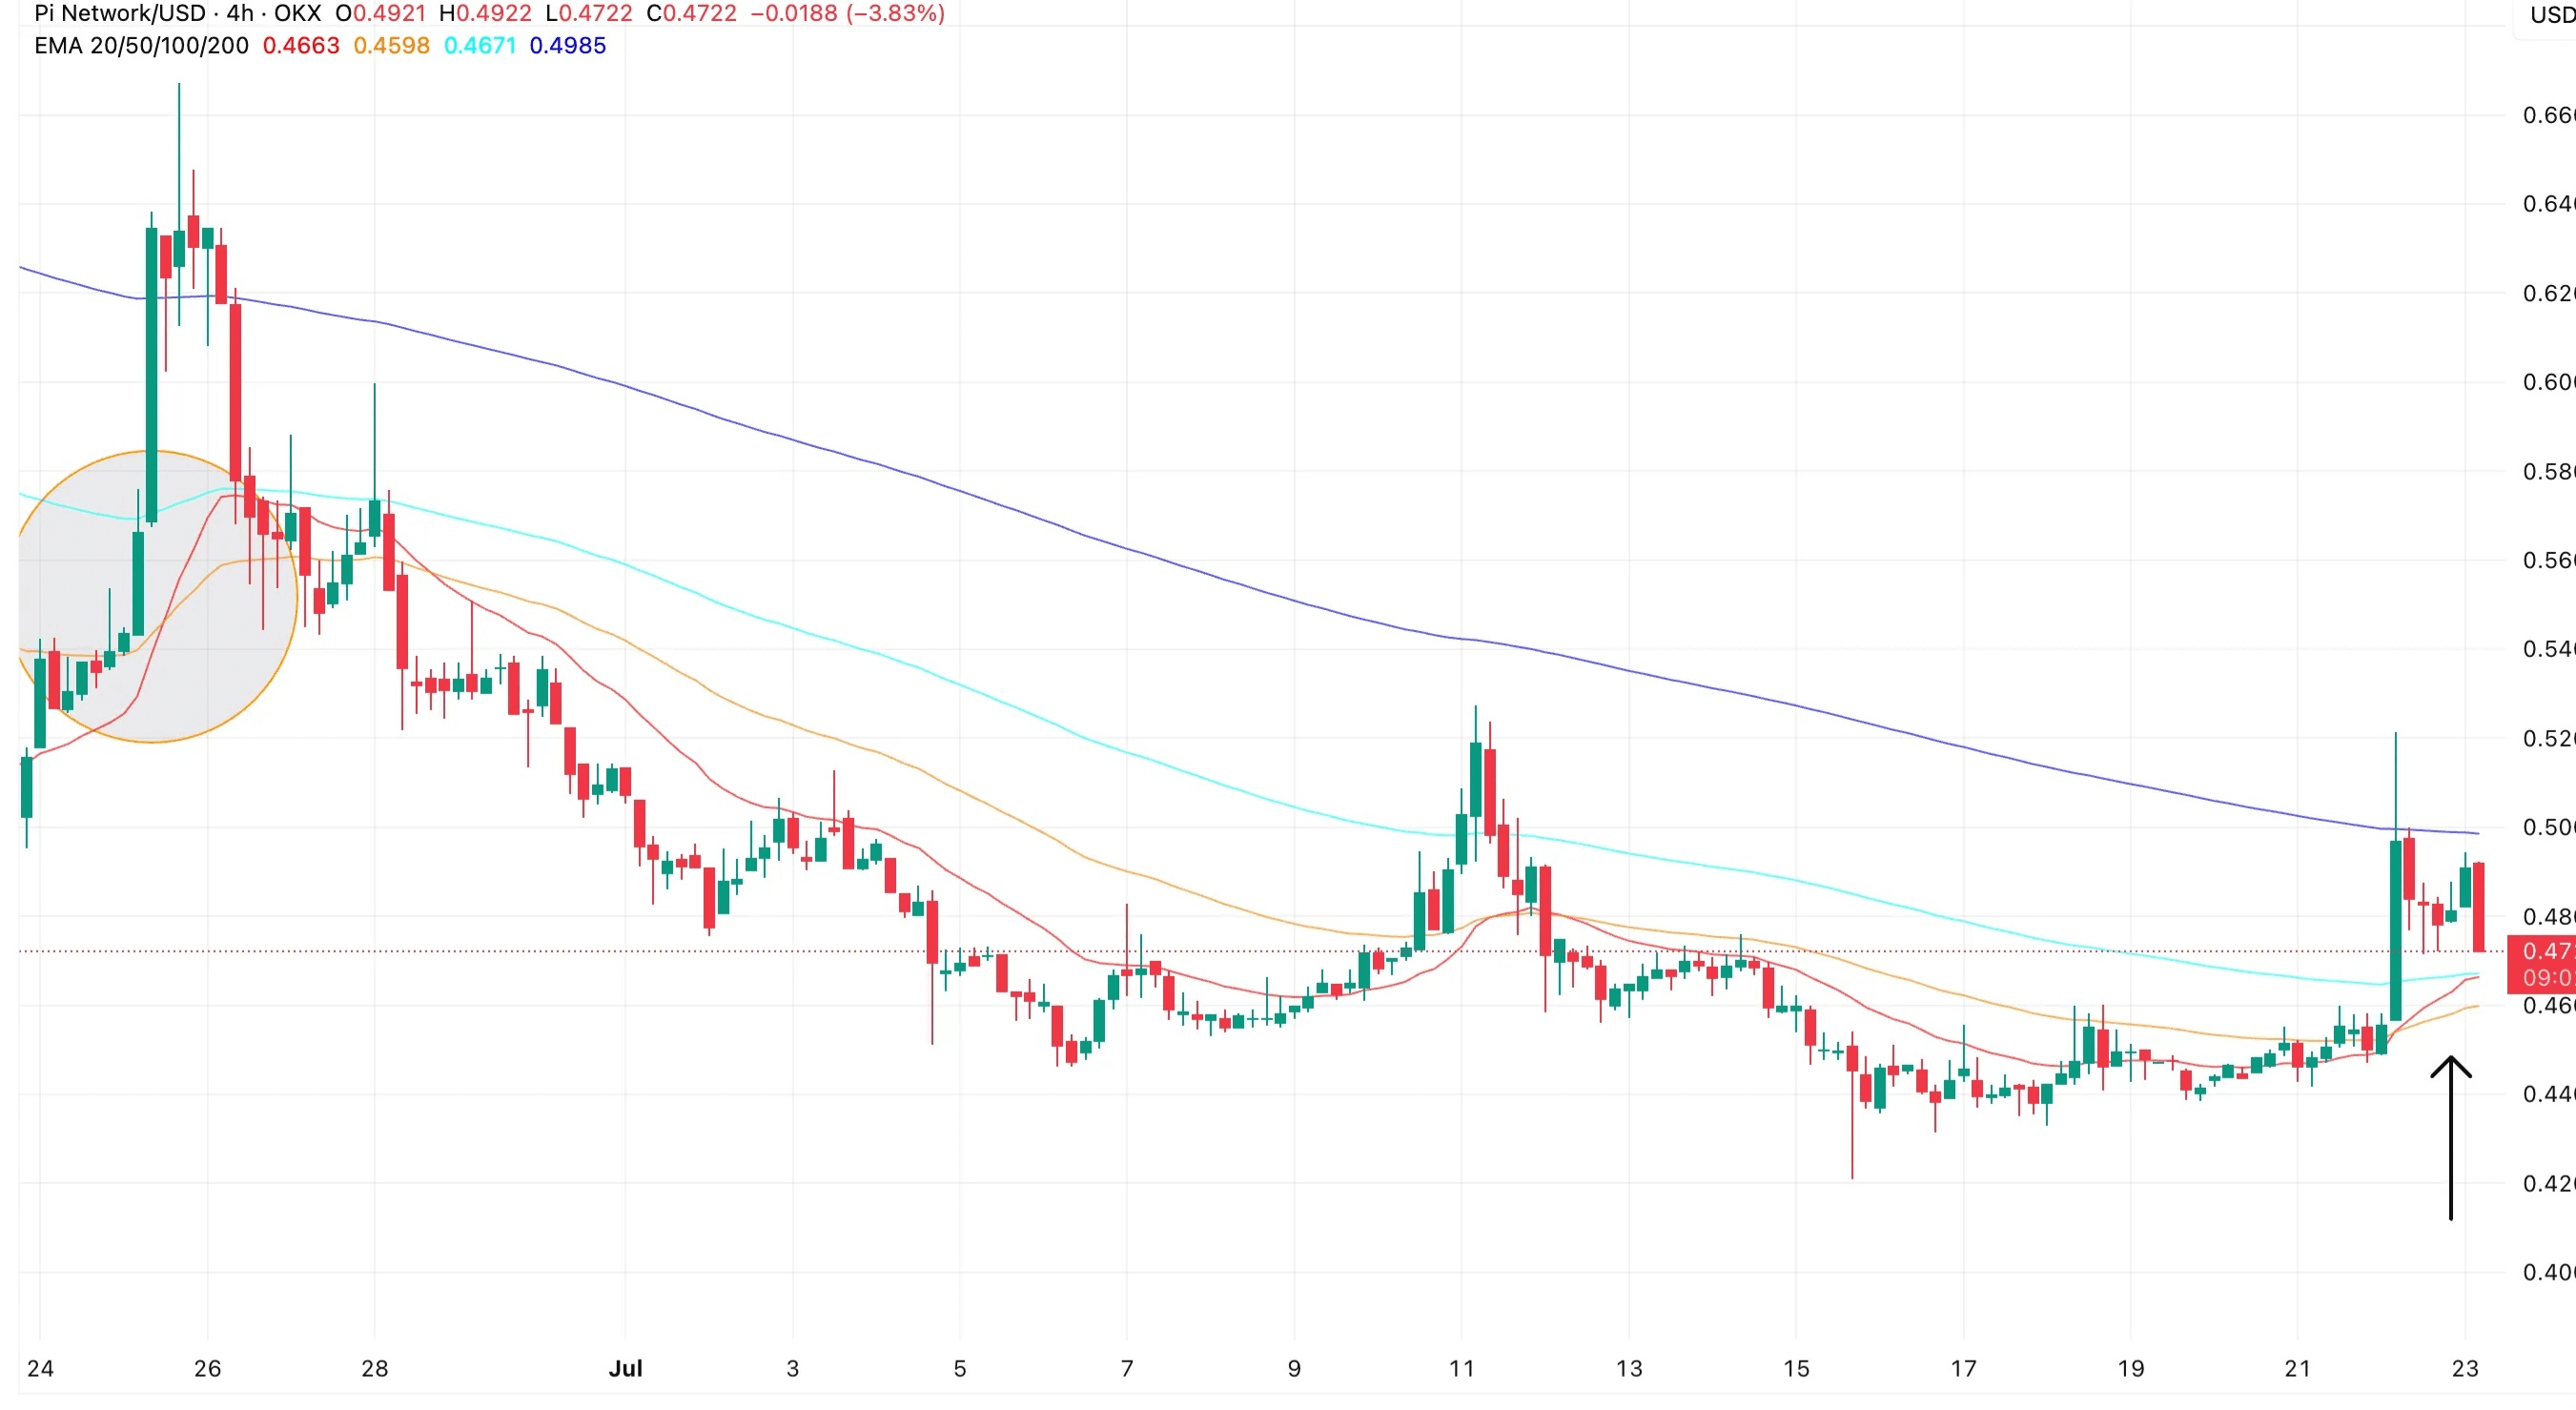
A similar situation occurred at the end of June when the price rose from $0.56 to $0.66. At that time, the EMA could not cross the 100-day EMA, and the Pi Coin rally stopped. Now, the second crossing is again close.
If the crossover occurs this time and the ADX remains stable, the chances of a PI price rally will increase.
========
On the 4-hour chart, the price briefly crossed the 200-period EMA (blue line) yesterday before meeting resistance. Closing above this line would confirm upward momentum.
========
Key price levels of Pi Coin to watch
The daily chart helps identify key levels. For this, we use Fibonacci trend correction. It connects three points: the low at the end of June at $0.47, the high around $0.66, and the pullback in mid-July to $0.42.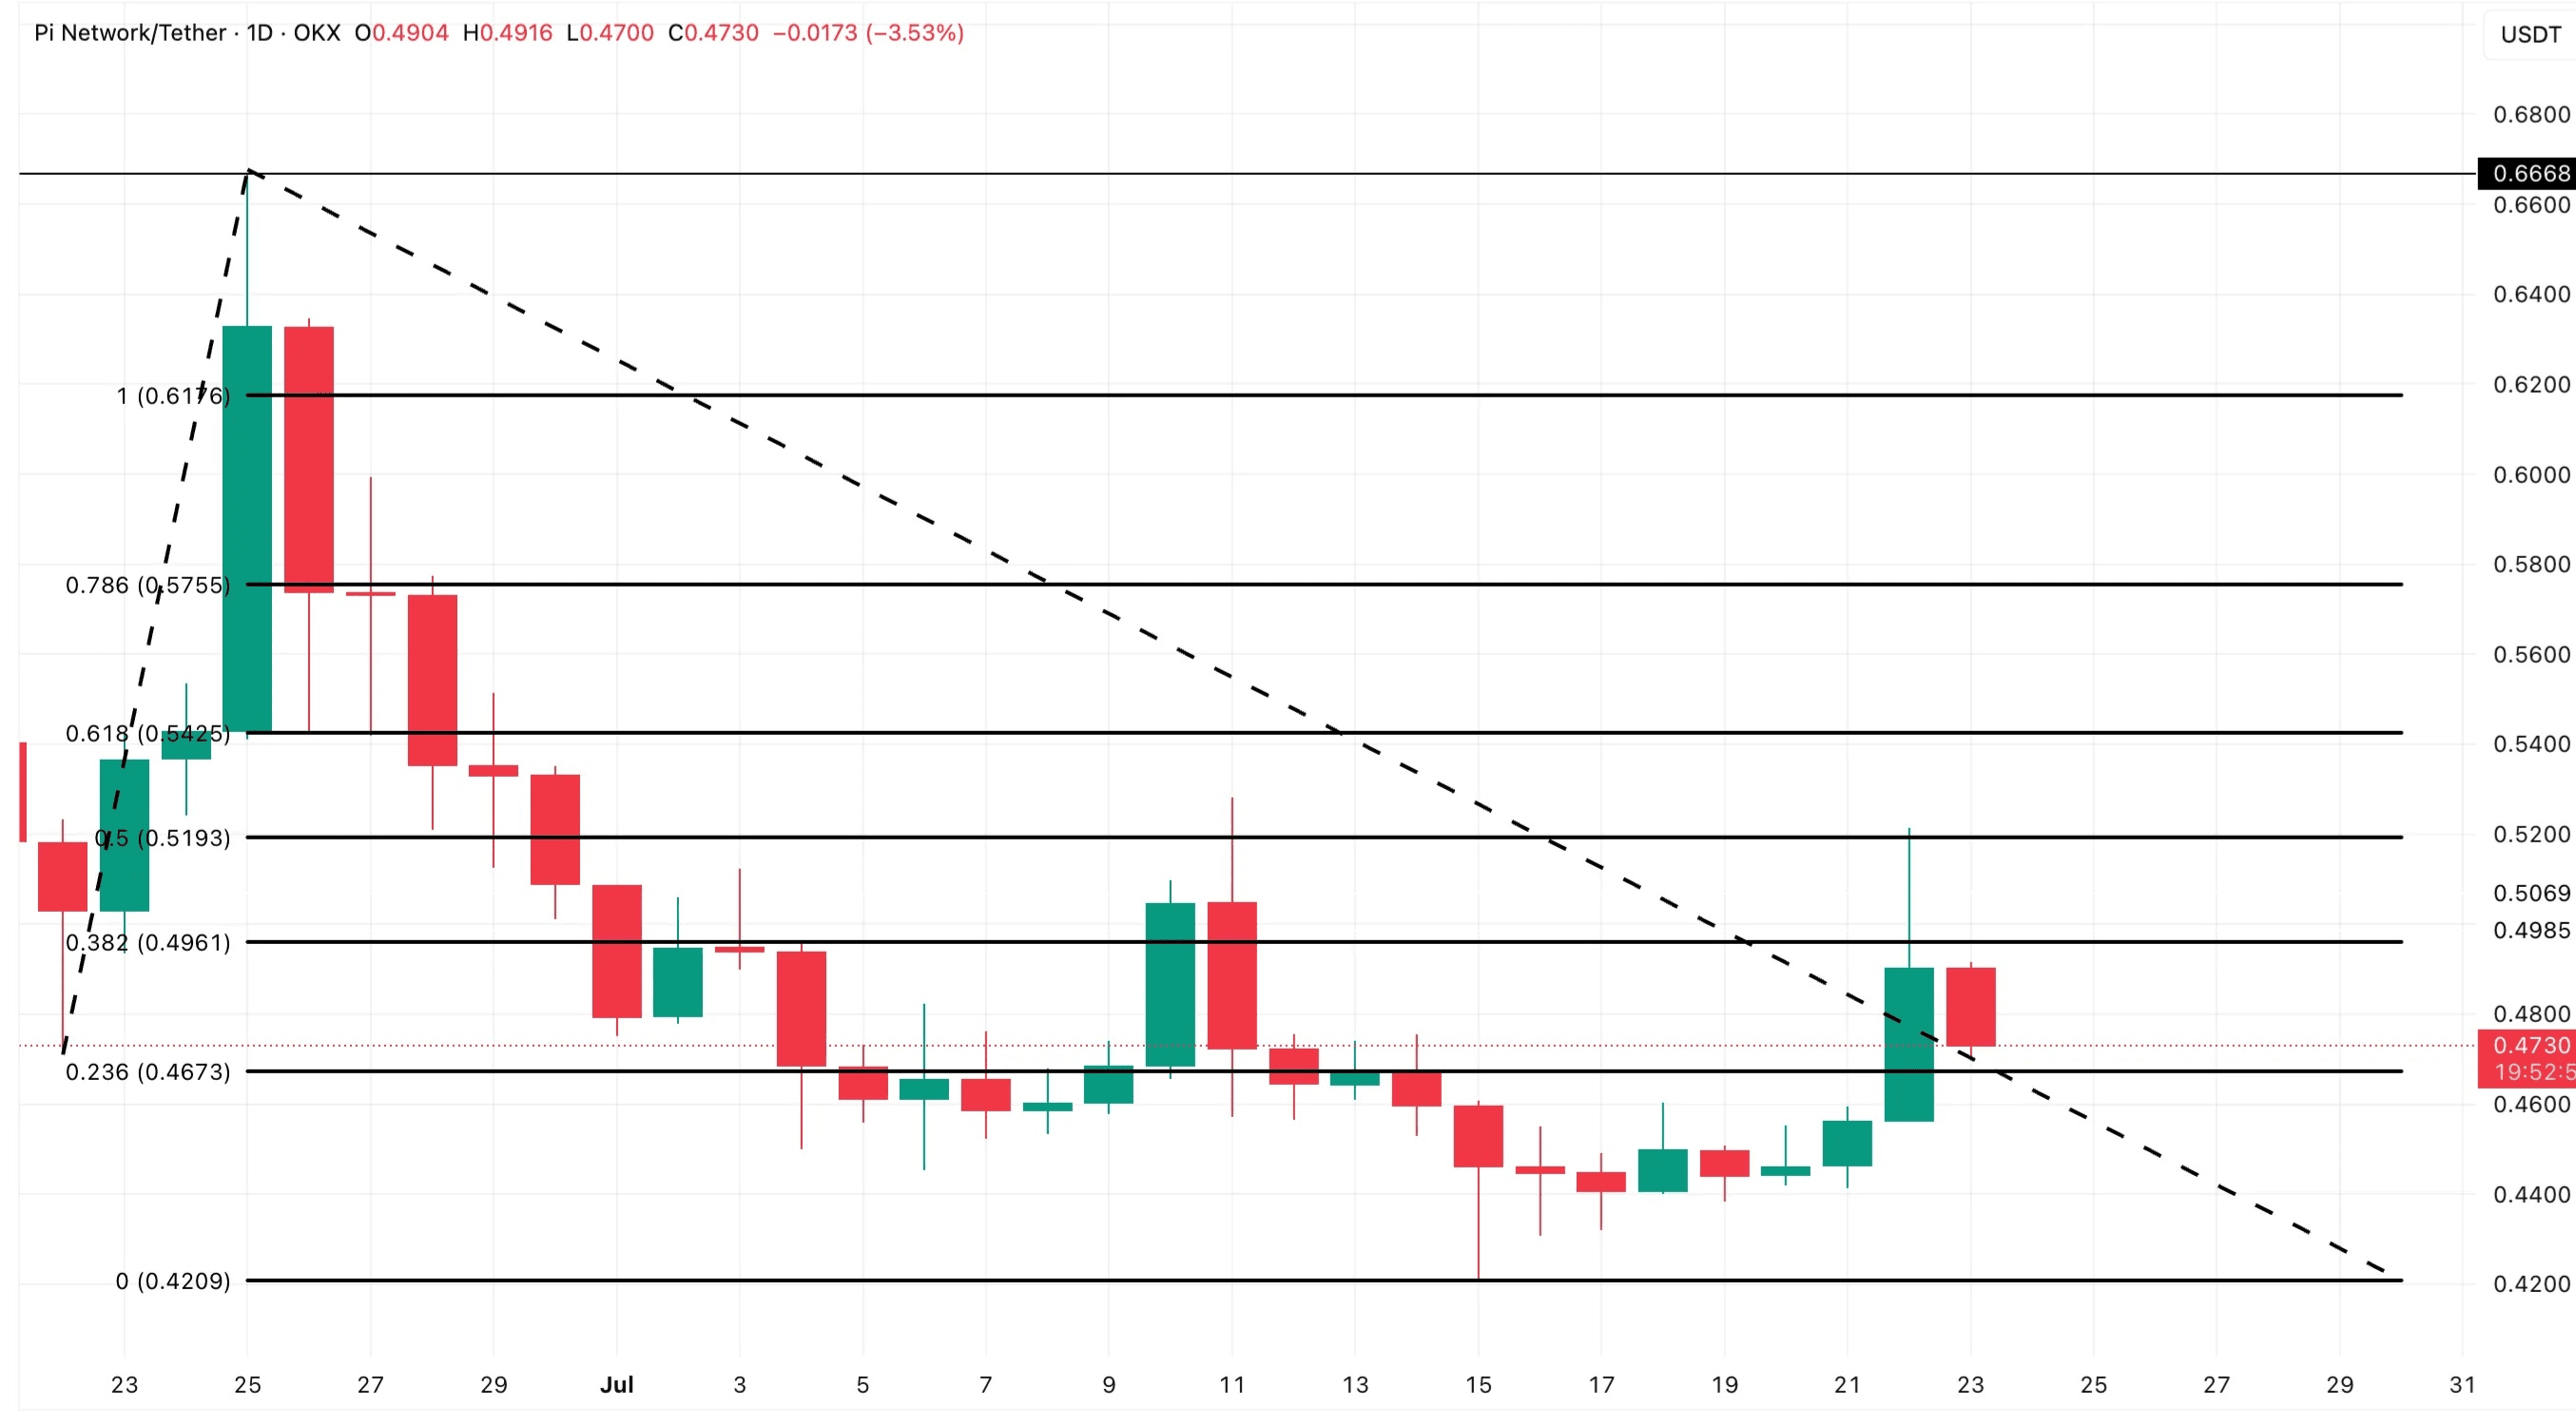
On Tuesday, the candle broke through three Fibonacci levels in one day: 0.236 at $0.46, 0.382 at $0.49, and 0.5 at $0.51. The price of PI is currently fluctuating in the range of $0.46–$0.49.
If the price closes above this range, it could reach $0.54 (0.618), and then $0.66, which is 40% higher than current levels, provided momentum continues and the EMA crosses.
A reversed bullish hammer formed on the bounce, indicating that buyers have activated around the lows.
If the price closes below $0.46, the ADX will fall below the mid-20s, and the 20-period EMA does not cross the 100-period line, the price of Pi Coin may return to $0.42.