Bitcoin is trading at $118,438 on July 24, 2025, with a market capitalization of $2.35 trillion and a 24-hour trading volume of $53.99 billion.
The leading cryptocurrency recorded an intraday price range between $117,422 and $119,197, reflecting ongoing consolidation near historical highs.
===========
On the daily chart, Bitcoin remains in a defined upward trend, but the recent price movement has transitioned into a consolidation phase at the upper range.
The formation resembles either an ascending wedge or a bullish flag, both typically seen in continuation trends; however, the lack of continuation volume raises questions about the strength of the bulls.
Key support is concentrated between $116,000 and $117,000, while resistance is at $123,000.
The technical bias remains neutral, leaning towards bullish, with traders watching for either a breakout above resistance or a drop below support to determine the next move.
A breakout above $123,000, especially on volume, is likely to resume bullish momentum.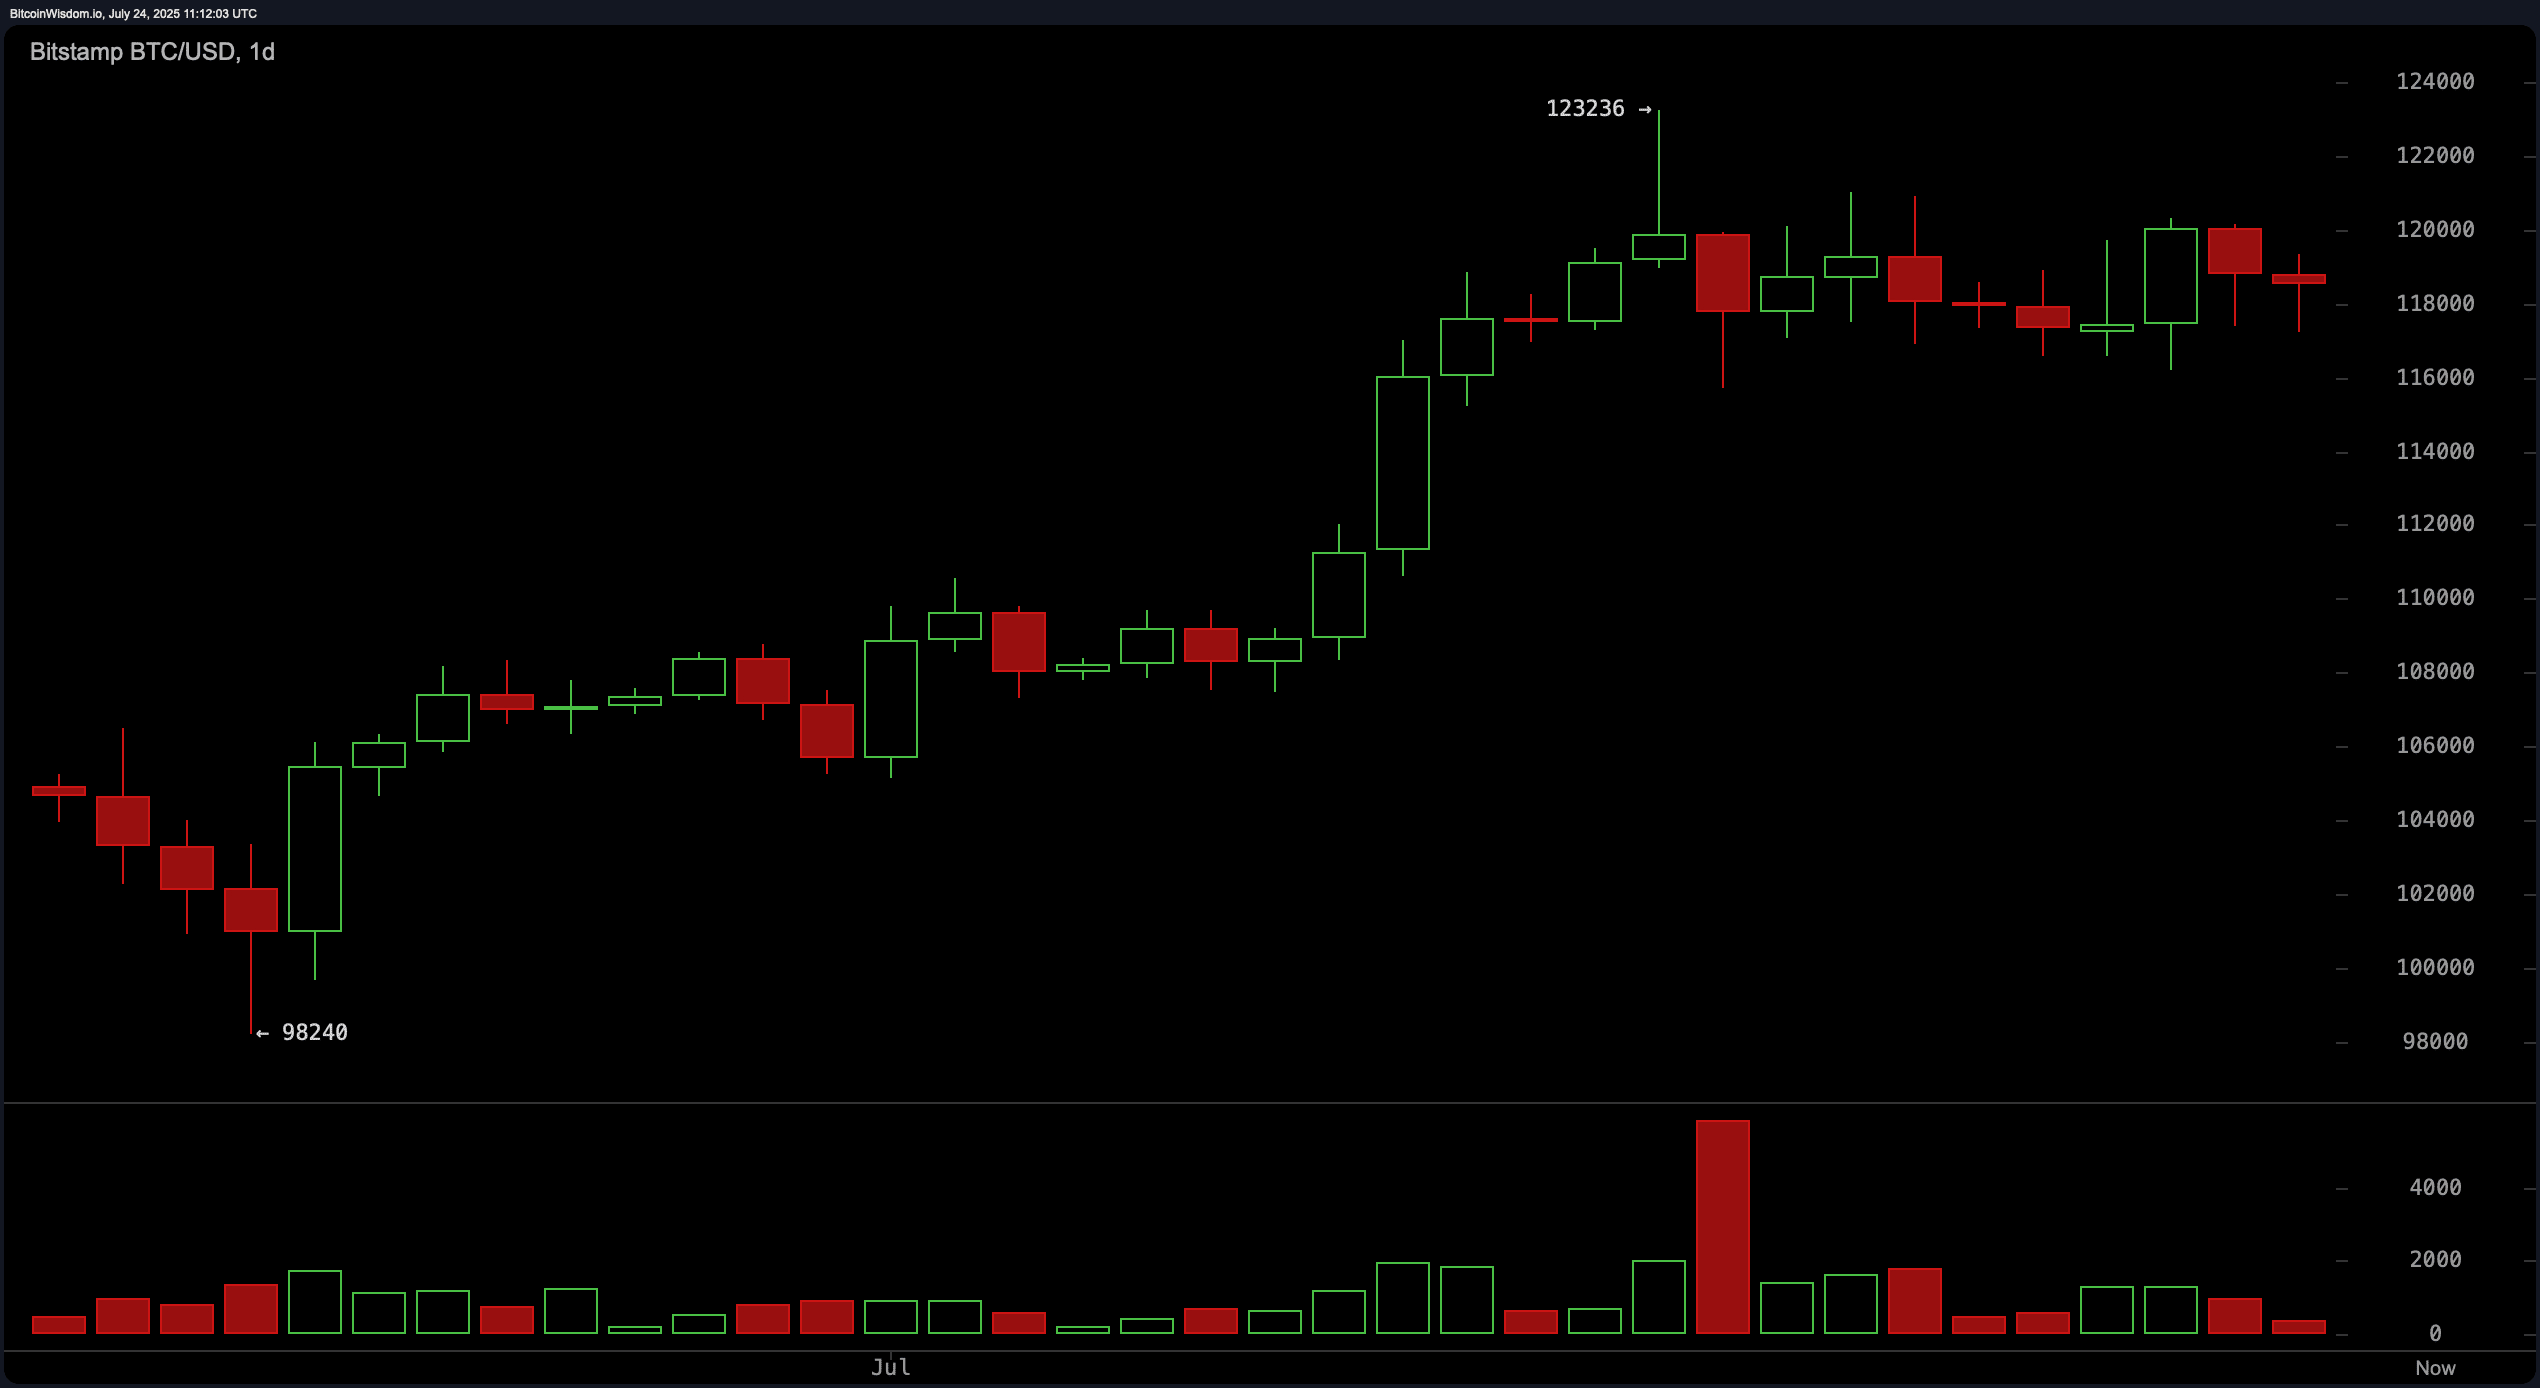
==========
The four-hour chart shows that Bitcoin is stuck in a horizontal range between $116,000 and $120,000, with multiple deviations at the upper boundary indicating buyer fatigue.
Volume analysis reveals a declining trend on bullish candles, signaling weakness in demand.
Additionally, a potential 'head and shoulders' pattern is forming, which may indicate an upcoming reversal movement if the neck support fails.
Immediate resistance is at $120,297, while support at the local low is held at $116,186.
Traders are advised to closely monitor the $116,000 level, as a breakout below it could nullify the broader bullish outlook.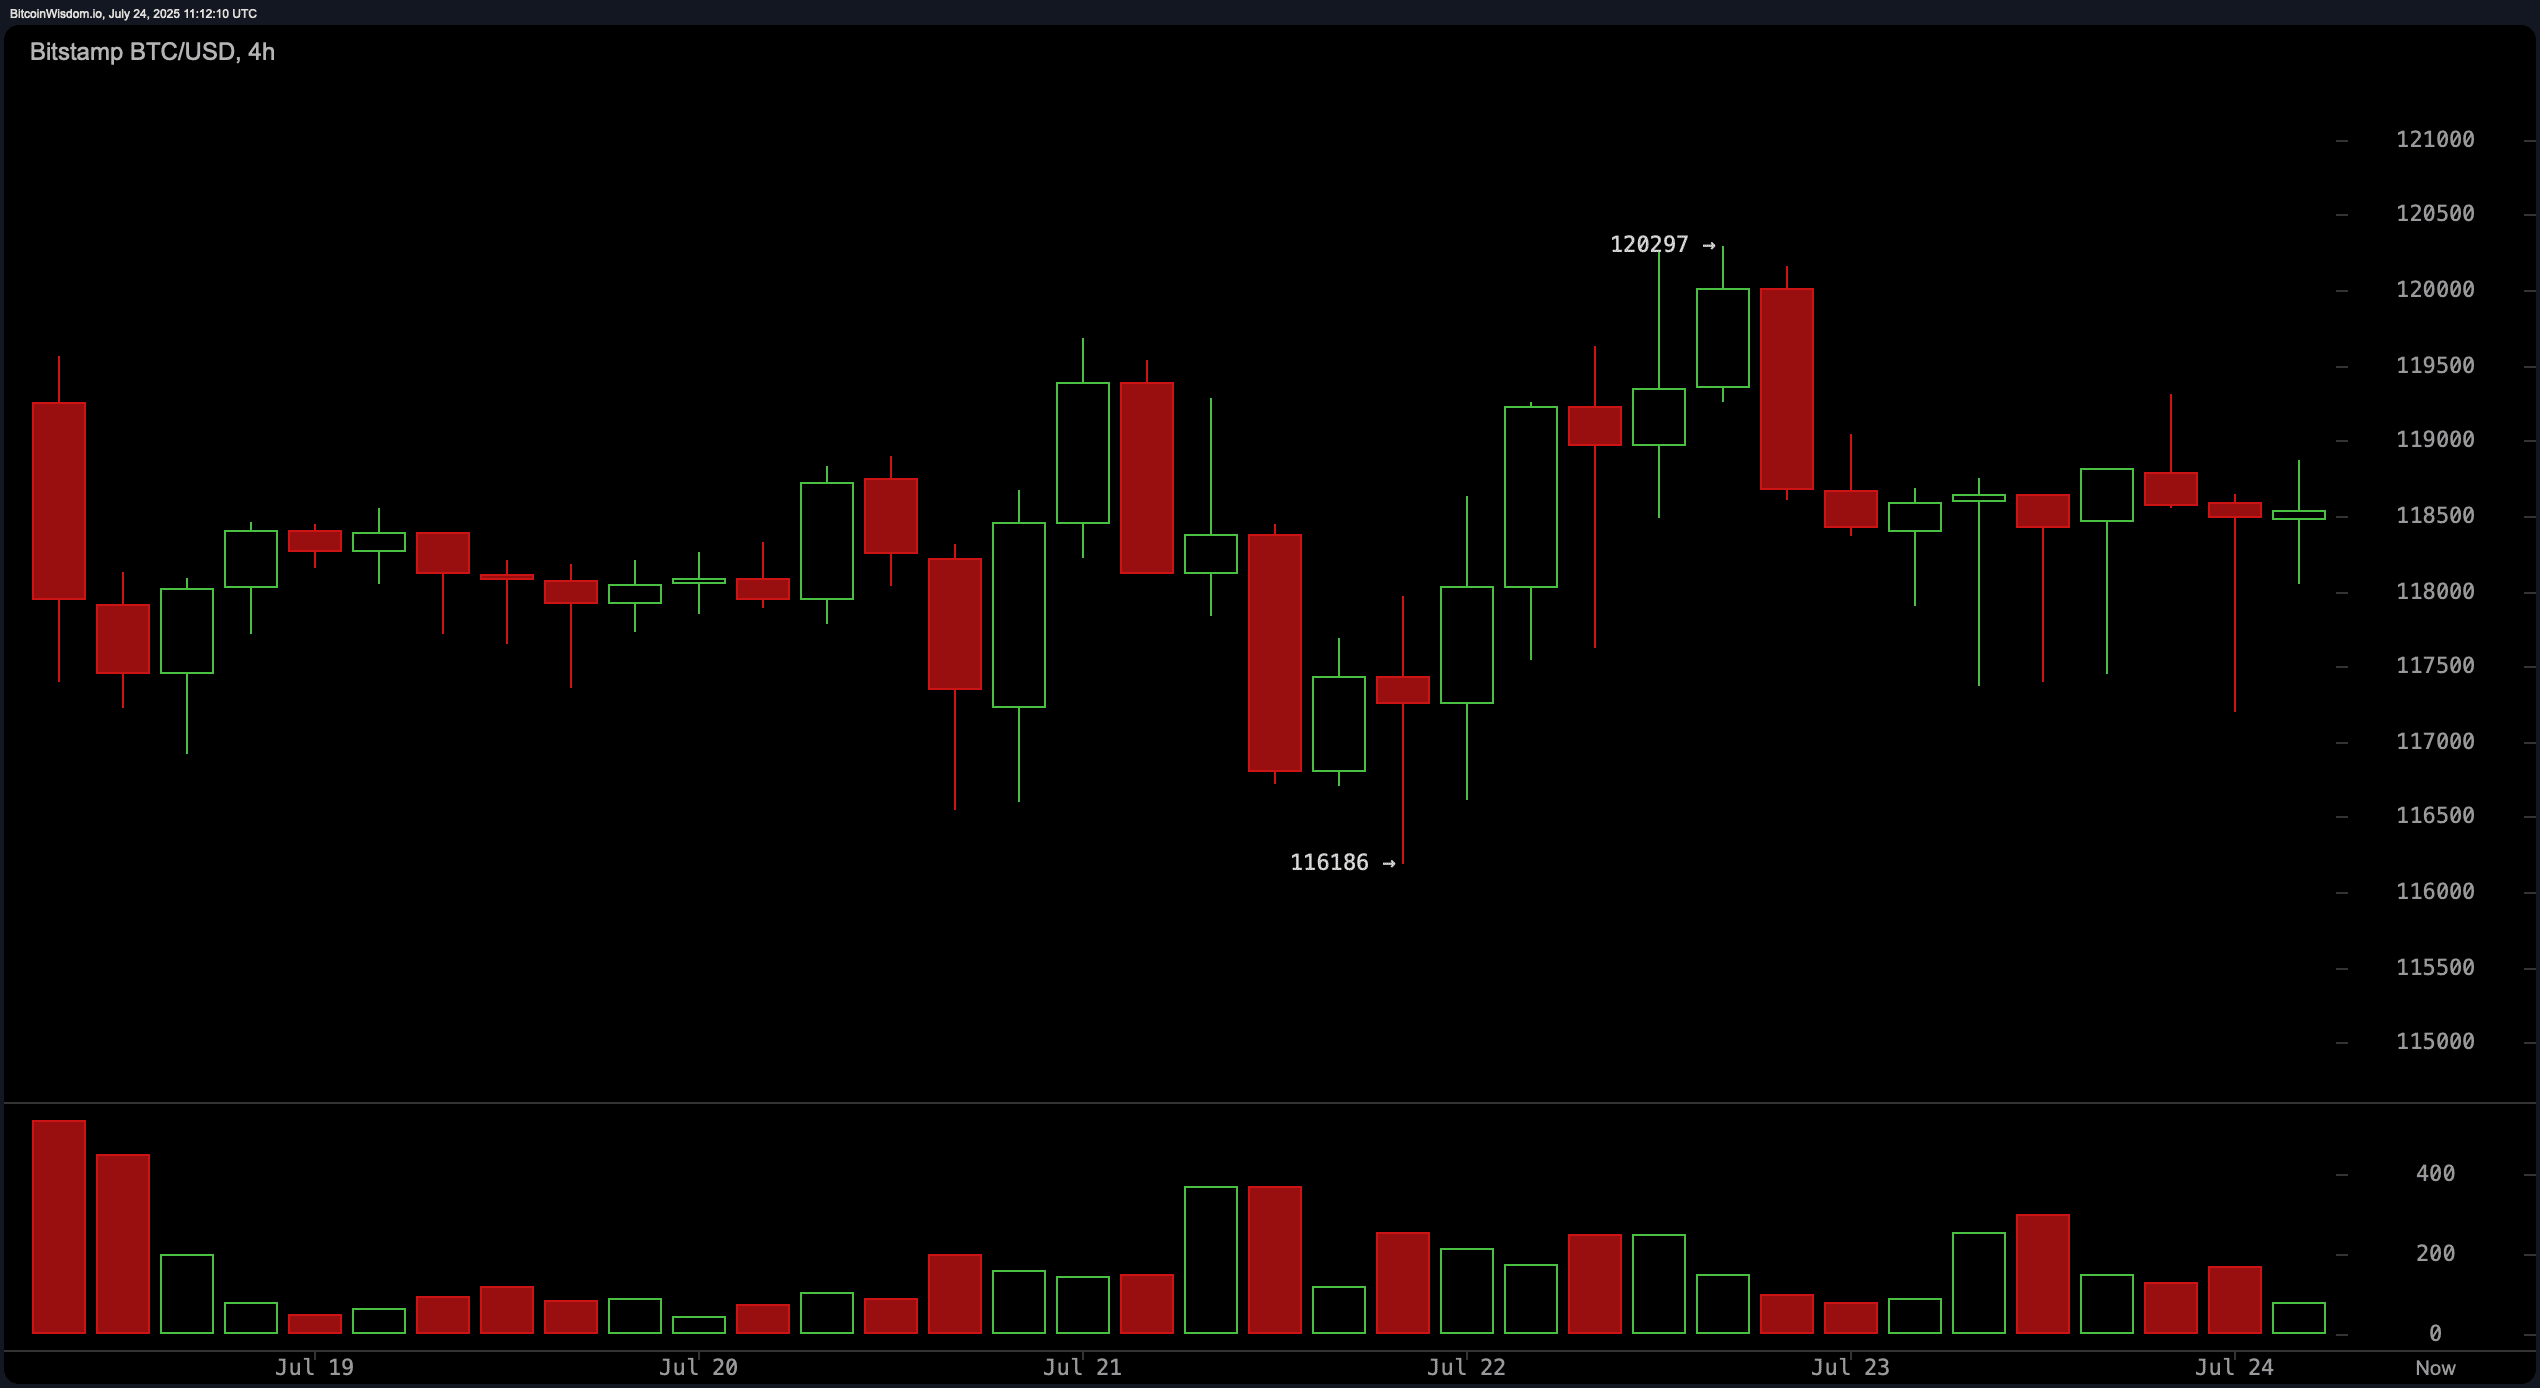
=======
Short-term price movement on the 1-hour BTC/USD chart shows a slight bearish bias, with lower highs being formed and resistance at the $119,000 level.
The recent higher low at $117,201 provides temporary support, but the overall trend remains weak amid higher volume on red candles.
This pattern corresponds to either a descending triangle or a bearish flag, both of which suggest continued downward pressure if buyers do not reclaim the $119,000 level with confidence.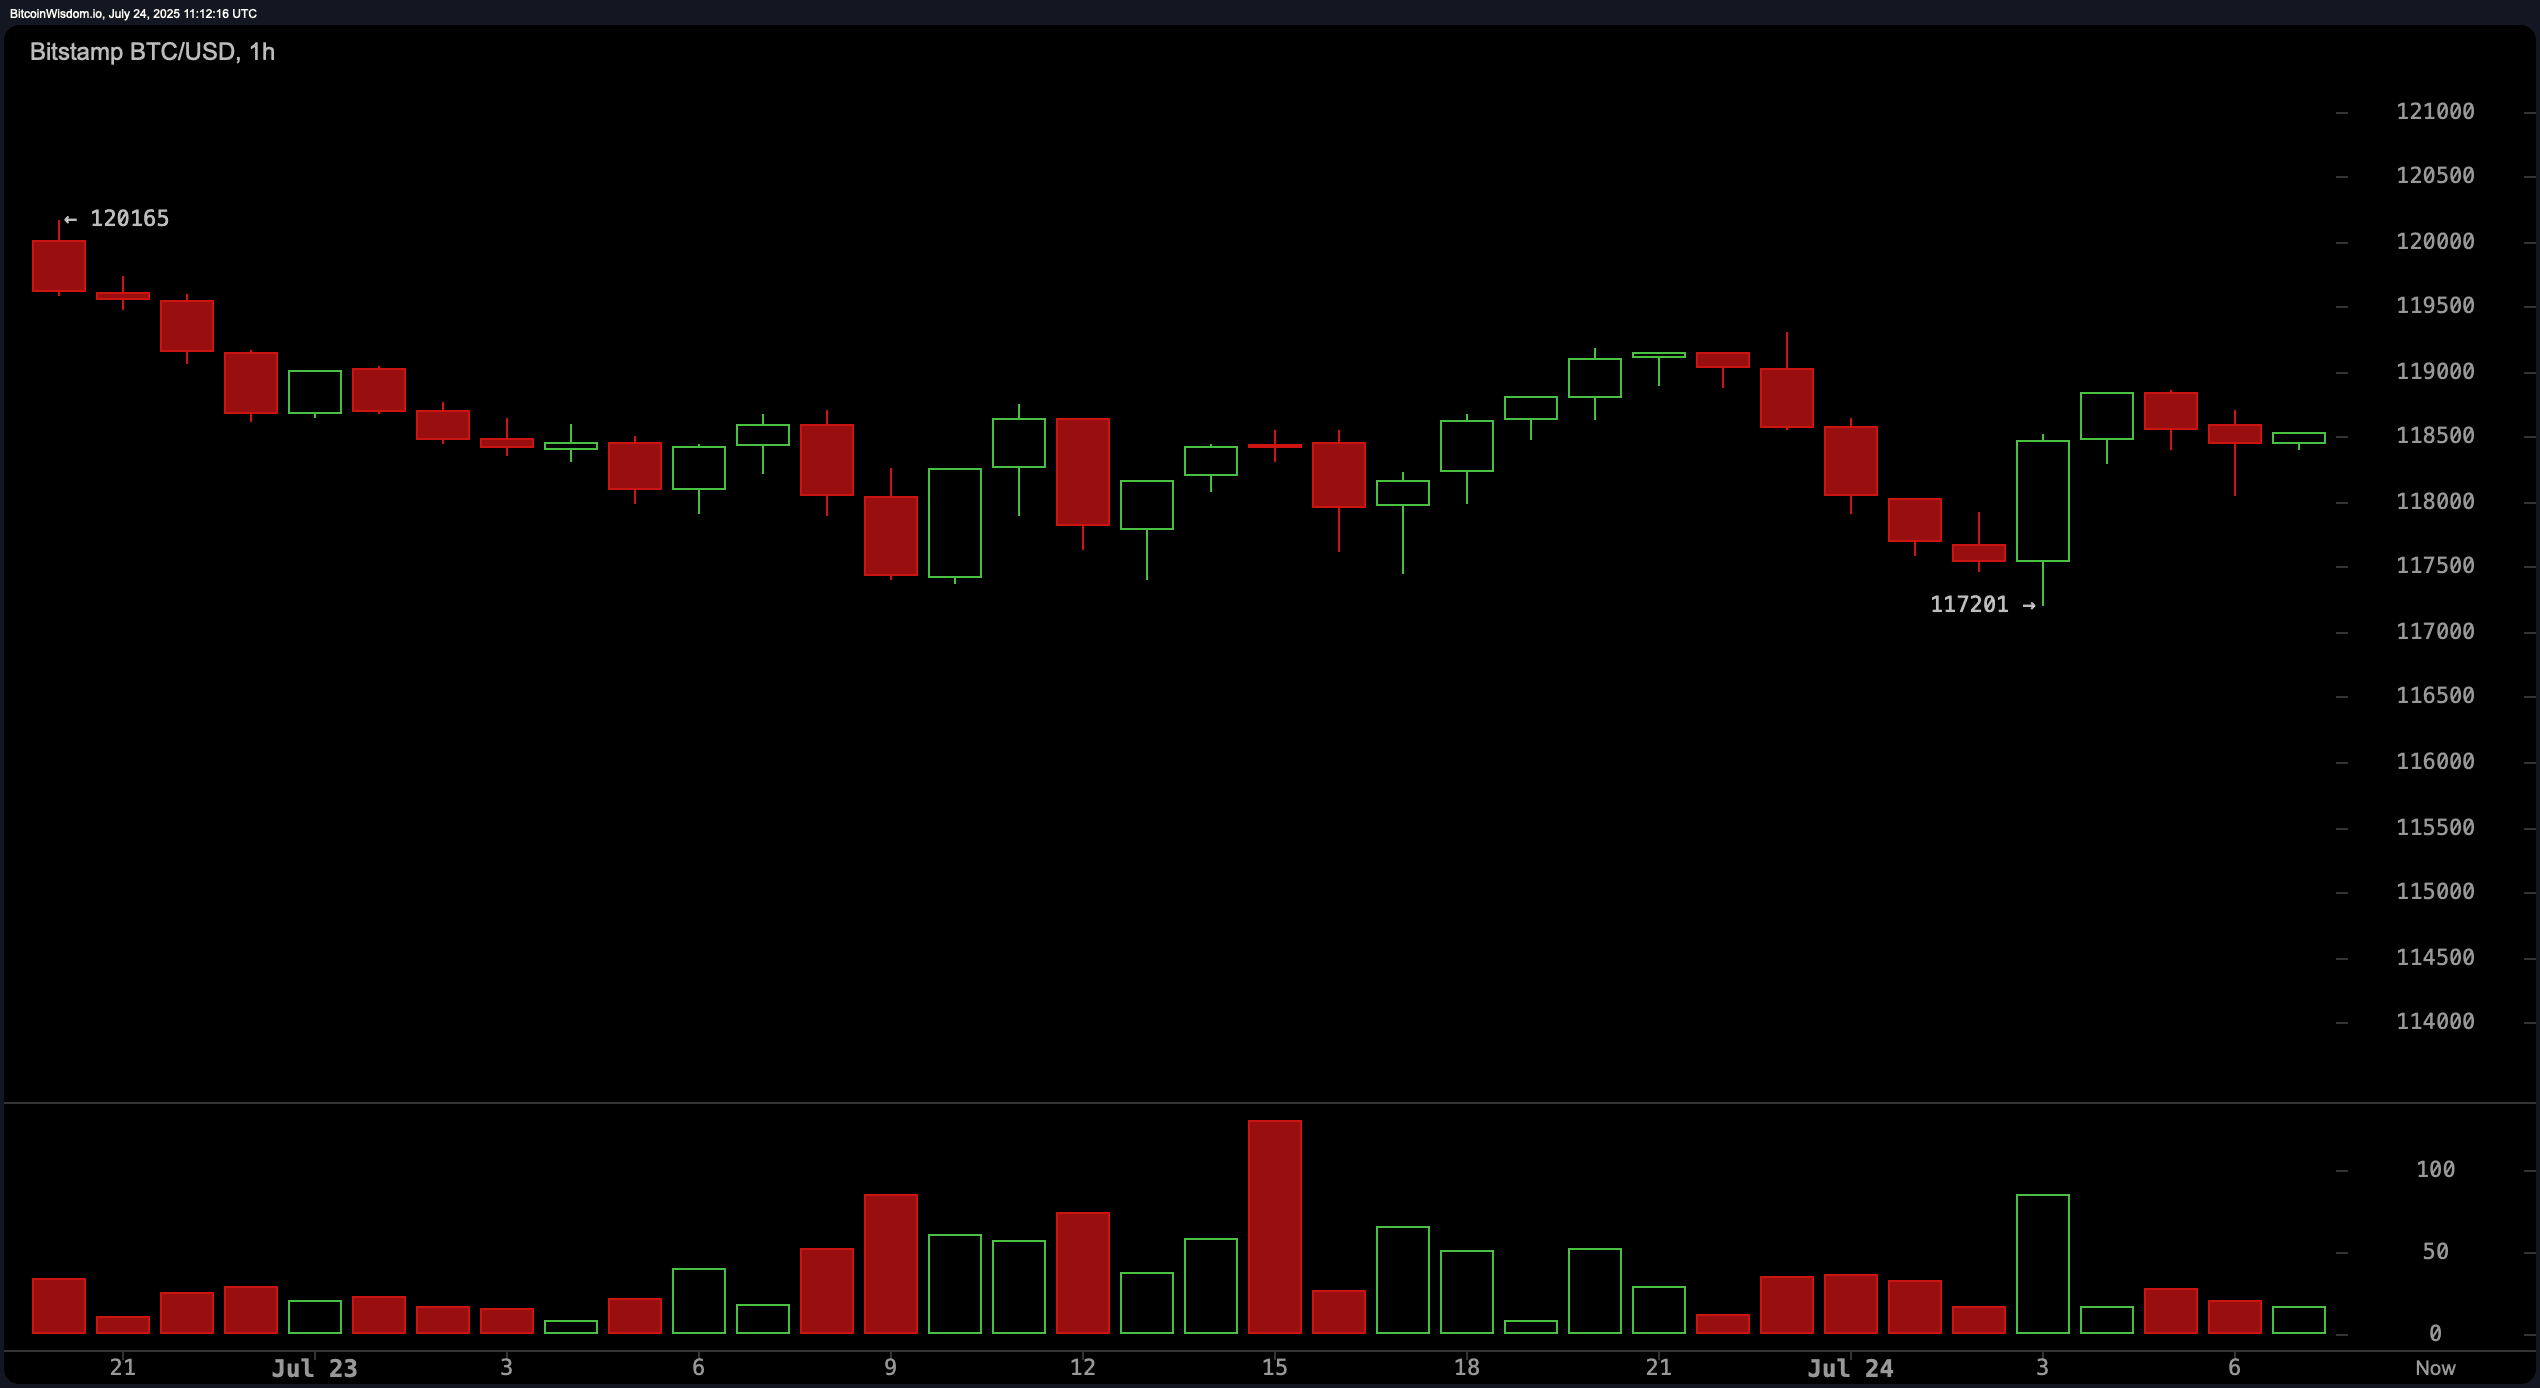
==========
Bullish verdict:
Despite the short-term consolidation and mixed signals from oscillators, the alignment of all major moving averages in favor of a continuation of the upward momentum suggests that Bitcoin remains in a structurally bullish trend.
A confirmed breakout above $123,000—especially with increasing volumes—could be the next catalyst to push Bitcoin to new highs, cementing this phase as a healthy consolidation within a broader upward trend.
===========
Bearish verdict:
Although Bitcoin remains near its highs, declining volumes, bearish short-term chart patterns, and sell signals from key oscillators such as momentum and MACD indicate a possible reversal.
If the support level at $116,000 does not hold, the risk of a deeper correction significantly increases, making caution necessary for traders until directional clarity returns.
