
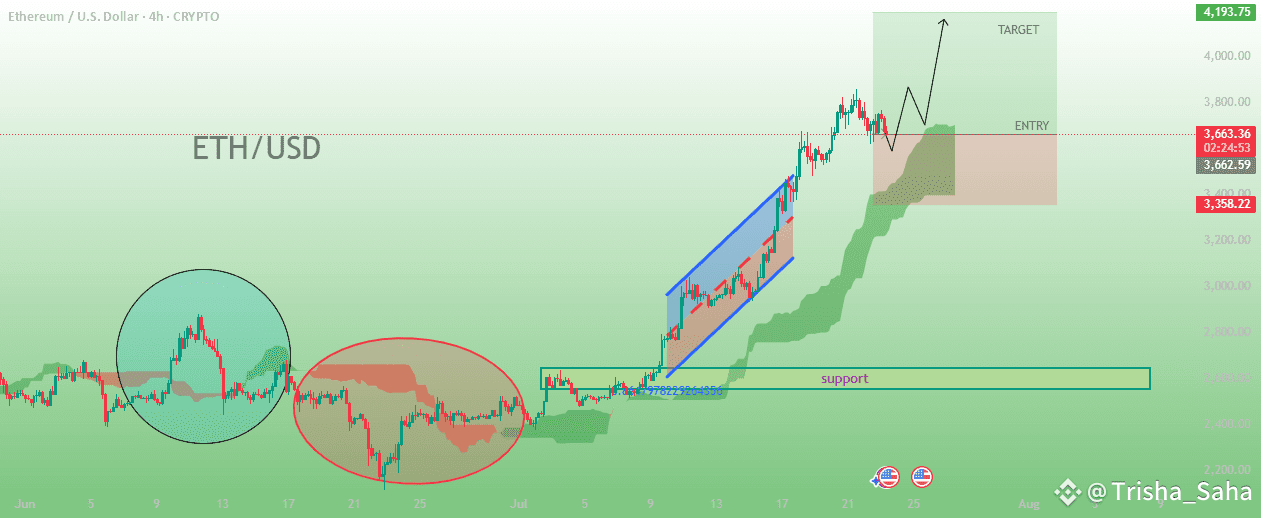
A green shaded area called the Ichimoku Cloud (or Kumo), indicating support/resistance zones and trend direction. Price is currently trading above the cloud, suggesting a bullish trend.
Two Circled Zones:
Blue Circle (left): Shows a local top or resistance area, possibly indicating a failed breakout or reversal.
Red Circle (middle): Indicates a consolidation zone or accumulation phase, where price moved sideways.
Green Box (right side): Marked with:
ENTRY: The price range considered as a potential buying zone.
TARGET: The projected upside target for the trade.
STOP-LOSS: Implied below the green box, marked in red (around $3,358.22).
Upward Arrow and Price Projection: Suggests an anticipated bullish breakout after some consolidation.
Support Zone: Highlighted horizontally near the bottom of the consolidation zone, labeled "support".
---
🔹 Price and Time Data:
Current Price: ~$3,658.96 (shown in the buy/sell box).
Date on Chart: Highlighted around Mon 14 Jul 25 (8:00).
Tabs and Tools: Multiple TradingView tabs open, suggesting active monitoring or analysis of other crypto pairs or instruments.
---
🔹 Interpretation:
This is a bullish analysis with:
A buy/entry zone between ~$3,500–$3,700.
A target zone above ~$4,000.
A stop-loss zone around ~$3,358.
The user appears to be forecasting a continuation of the uptrend, based on technical indicators and past price behavior.
#CryptoClarityAct #BNBBreaksATH #TrumpBitcoinEmpire #BTCvsETH #ETHBreaks3700