After a strong 35% increase in the past week, Pudgy Penguins (PENGU) is now hovering just below a critical resistance level.
While the majority of the altcoin market is cooling off, PENGU's price shows signs of readiness to breakout if it can surpass a crucial 'wall'. A deeper analysis of buying pressure, liquidation events, and the price chart indicates that this token still has room to continue rising.
PENGU: The buyers completely dominate the game.
In the past 24 hours, PENGU has risen 18%, indicating that the bulls are still in control. The Bull-Bear Power (BBP — used to compare recent peak and trough prices to measure market strength) is currently signaling positively, at around 0.0148. This level shows that buyers are still in control, despite short-term corrections.
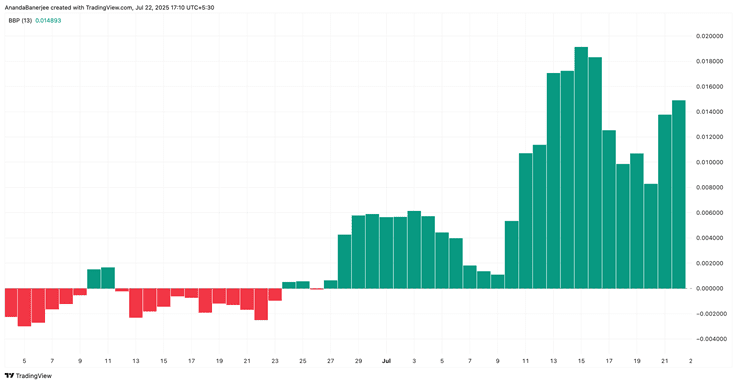
Simply put, when the BBP is positive, the bulls are stronger than the bears. PENGU's BBP has remained above the threshold of 0 since the end of June, even as the price fluctuates below the important resistance area.
This stable strength is a sign that the current pullbacks are just a temporary 'cooling off' phase before the price continues to rise.
If the BBP continues to remain positive as the price surpasses resistance, that could confirm PENGU still has upward momentum. Conversely, if the BBP turns negative, this could be a warning signal of a deeper correction about to occur.
The 7-day liquidation map shows the situation leaning towards the shorts.
Currently, PENGU is trading around $0.044. The 7-day liquidation map has recorded accumulated leverage from short positions reaching $10.46 million, compared to $10.18 million from long positions — showing a slight leaning towards shorts.
However, the difference between longs and shorts is not too large, so any price push in either direction could shape the next trend for PENGU.
Nevertheless, when the bulls are clearly in control and there is too much large-sized margin — as confirmed by the BBP, price action could have a greater impact on short positions than on long positions.
The liquidation map shows significant accumulation activity from short positions. If PENGU's price rises sharply, those betting on a price drop may be forced to buy back to cut losses, further pushing the price higher.
PENGU's price action suggests a level of $0.05.
Technically, PENGU's price has successfully broken out of the Fibonacci level 0.382 near $0.039 after two failed tests and has even surpassed the corresponding Fib 0.5 level of $0.0424.
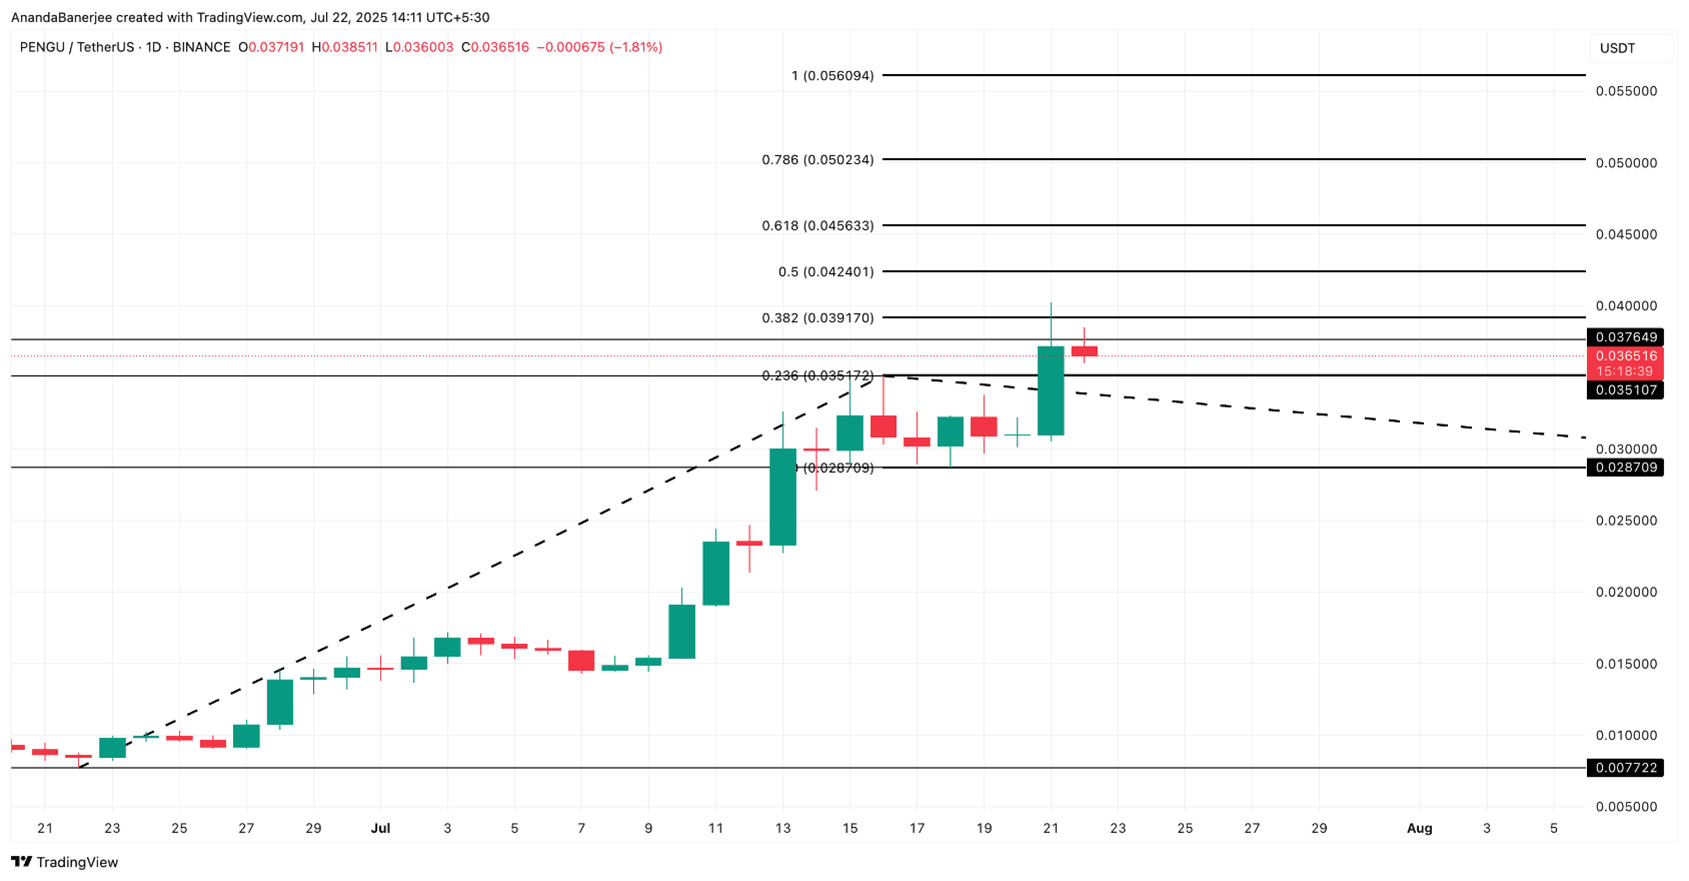
The chart uses the Fibonacci extension tool according to the trend. This tool connects from the swing low at $0.0077 to the nearest swing high at $0.035, then to the subsequent retracement level at $0.028. This tool helps identify the next price targets of the token while in an uptrend.
If PENGU's price can clearly break through the Fibonacci 0.618 area at $0.045, the next target will be $0.05. If this level is surpassed, the next resistance level will be $0.055, corresponding to Fibonacci 1.
The confirming factors for this bullish scenario include: weakening selling pressure, accumulation of short positions, and a strong chart structure. However, the uptrend will be invalidated if PENGU breaks below the newly formed support area at $0.039 (previously resistance), or if the price continues to drop and hits the Fibonacci extension retracement area at $0.028.