Bitcoin continues to be restrained around the $120,000 mark as selling pressure increases, but a positive sign is that the bulls have firmly kept the price from sliding below $115,000 in recent days. This indicates that buying pressure is quietly accumulating every time the price makes a slight adjustment, contributing to the overall upward momentum.
According to data from SoSoValue, Bitcoin's spot ETF funds recorded a net outflow of $131.35 million on Monday's trading session. However, it is worth noting that this figure comes after a streak of 12 consecutive days of net inflows of about $6.6 billion — indicating that investor sentiment remains optimistic and they are not in a hurry to take profits, betting on the continued bullish outlook.
Not only Bitcoin, but Ether (ETH) is also becoming a focal point attracting capital flows. CoinShares reported that ETH-related investment products have recorded a record inflow of $2.12 billion in the past week — double the previous high of $1.2 billion.
Will Bitcoin be able to break through the resistance zone to extend the upward trend? And will altcoins be able to sustain their current recovery? Let's analyze the charts of the top 10 cryptocurrencies to find the answer.
Technical Analysis of SPX
The S&P 500 index (SPX) rebounded from the 20-day exponential moving average (6,218 points) on Wednesday, indicating that buying pressure emerged as prices corrected.
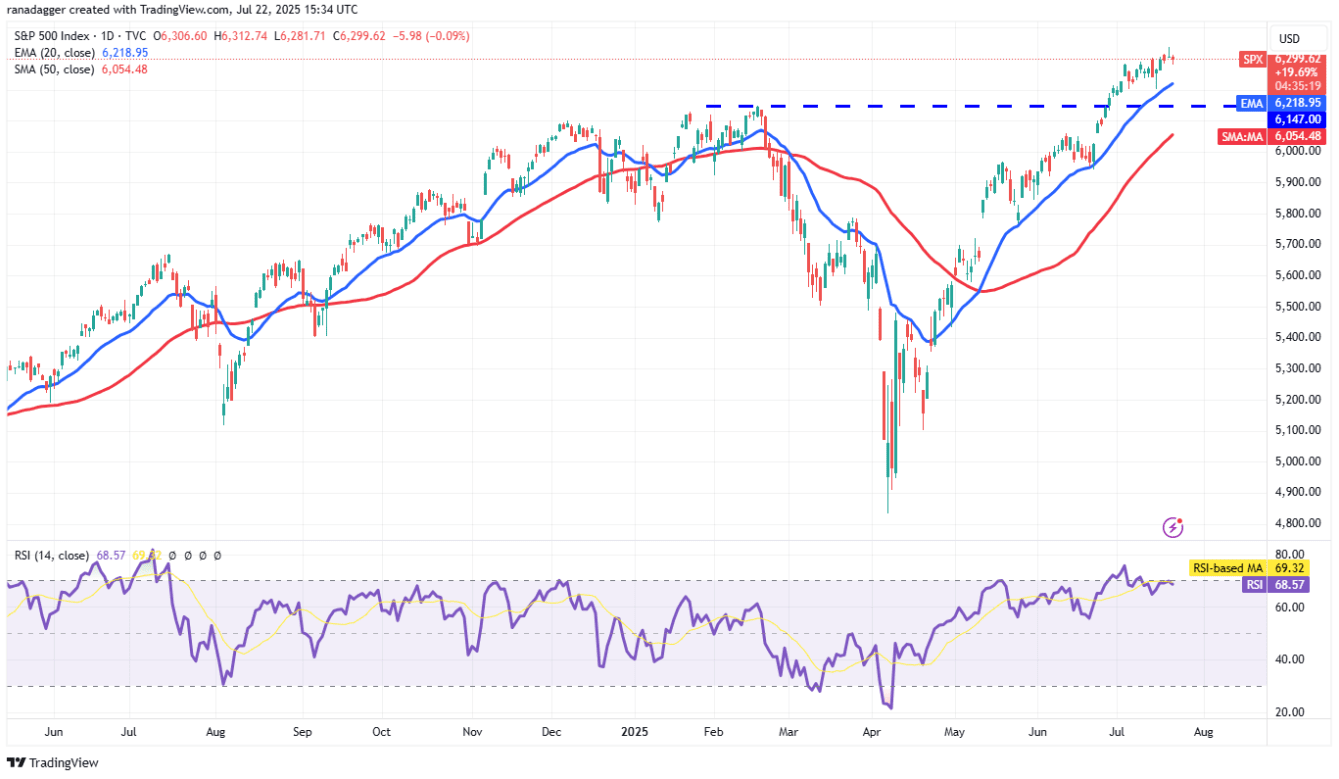
The rising moving averages along with the relative strength index (RSI) near the overbought zone indicate that the bulls still control the market. They will attempt to push the price to the 6,500 points zone — a forecasted strong resistance level.
Conversely, the bears will need to pull the price below the support zone of 6,147 points to weaken the upward momentum. At that point, the index could slide down to the 50-day simple moving average (SMA) at 6,054 points — this is a crucial support area to watch. A break below the 50-day SMA would signal that the index may have formed a short-term peak.
Technical Analysis of DXY
The recovery of the US Dollar Index (DXY) has stalled at the 50-day SMA ($98.56), indicating that selling pressure has emerged as prices rise.
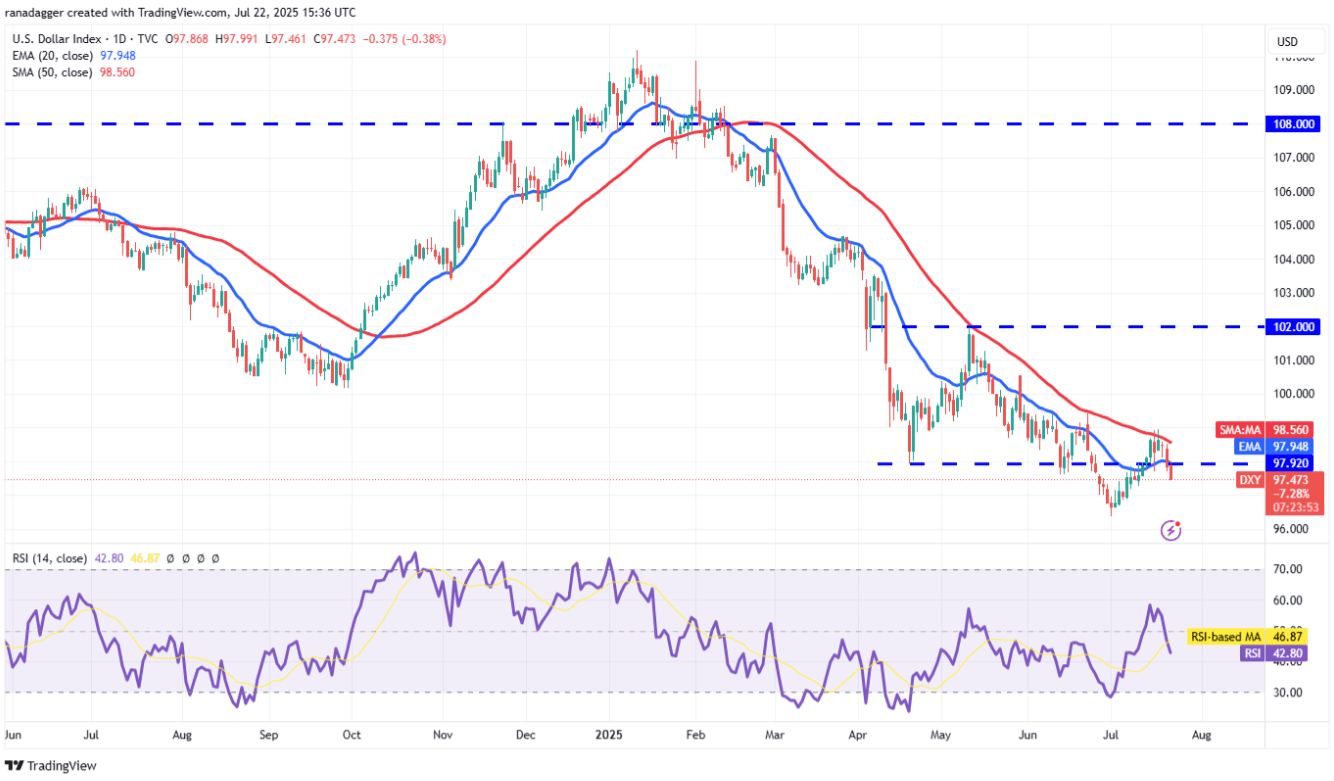
The bears have increased their influence by pulling the price below the 20-day EMA ($97.94). This opens the possibility of a decline to the 97.17 zone and further to the crucial level of 96.37.
This negative view will be invalidated in the short term if the price rebounds strongly and rises above the 50-day SMA. This indicates the formation of a higher low and increases the likelihood of recovery to the level of 100.54. Although there is light resistance at 99.42, this level is likely to be surpassed.
Technical Analysis of BTC
The bulls are not allowing the price to drop below $115,000, but they are struggling to push the price above the $120,000 mark.
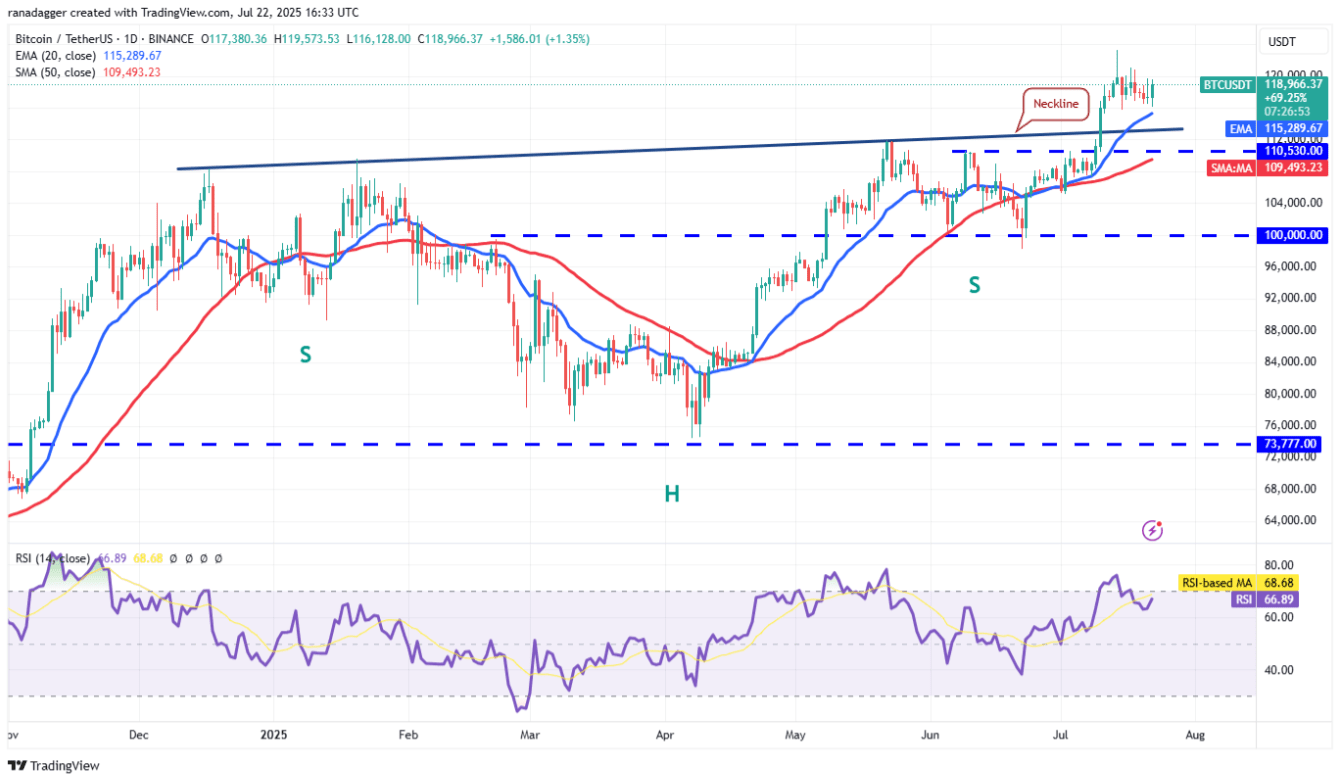
The 20-day EMA ($115.289) is rising and the RSI is in the positive zone, indicating that the path of least resistance is upward. If the bulls push the price above $123.218, the BTC/USDT pair could accelerate and surge to $135.729, followed by the model target at $150,000.
The bears will need to pull the price below the support of $110.530 to gain an advantage. At that point, selling pressure could increase and pull the price down to $100,000.
Technical Analysis of ETH
Ether surpassed the resistance of $3,745 on Sunday, but the bulls could not maintain the breakout momentum.
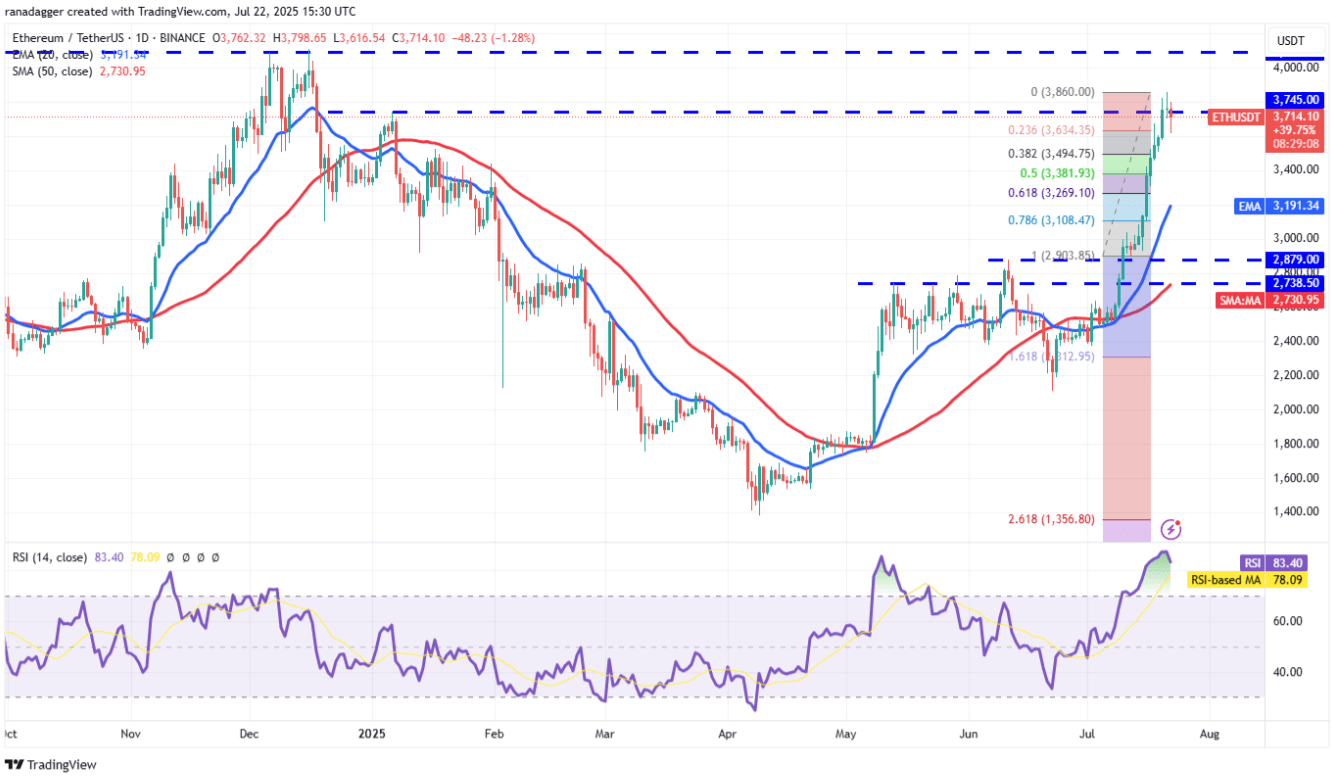
The price turned down below $3,745, indicating that the high price zone is attracting selling pressure. The ETH/USDT pair could adjust to the 38.2% Fibonacci retracement level at $3,494, and further to the 50% level at $3,381. If the price rebounds from this support zone, the bulls will once again attempt to push the price to $4,094.
Conversely, if it breaks below $3.38, the price could drop to the 20-day EMA at $3.191, which would delay the upward trend.
Technical Analysis of XRP
XRP surpassed the resistance of $3.40 on Thursday, and the bulls have maintained the price above the breakout zone, indicating an effort to turn the $3.40 zone into support.
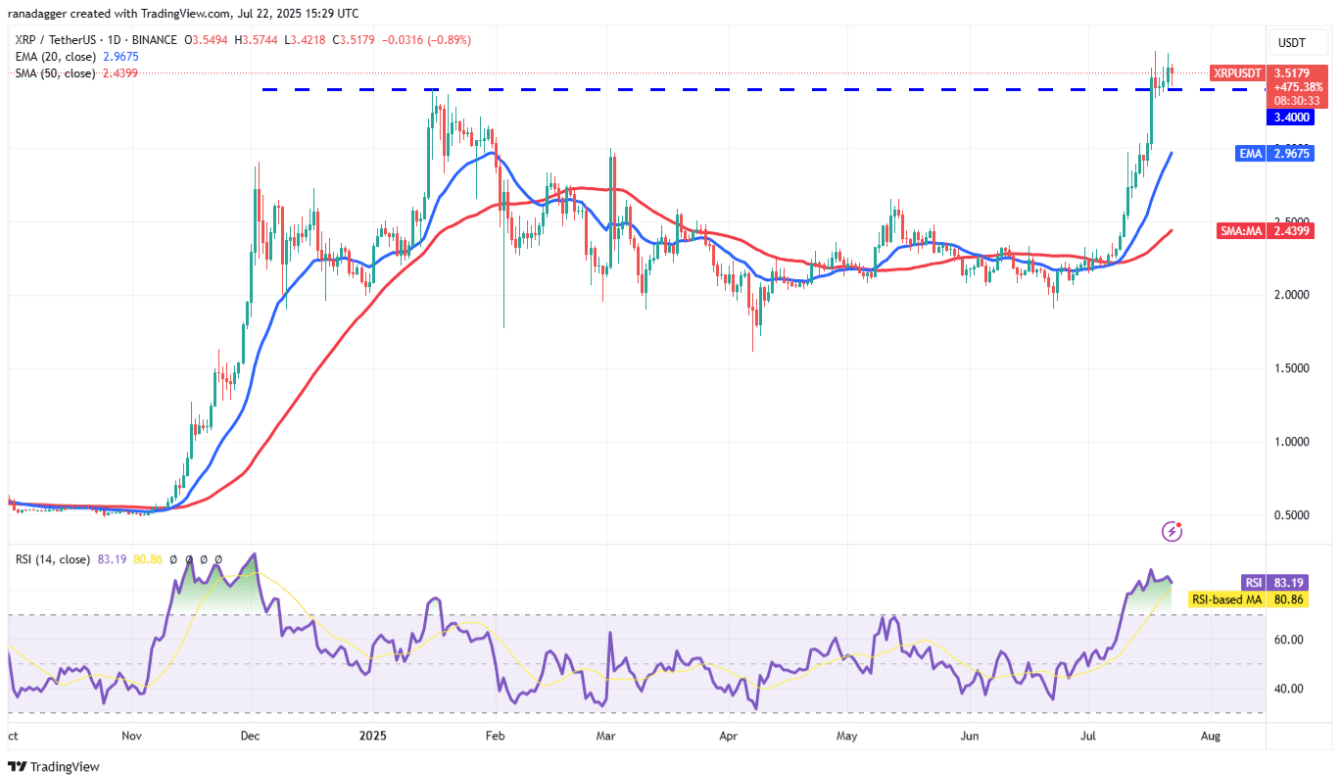
If the price rises above $3.66, the XRP/USDT pair could continue its upward trend. The next target is $4, followed by the level of $4.86.
Although the trend remains bullish, the RSI is in the overbought zone, increasing the risk of a correction or sideways movement in the short term. If the price decreases and closes below $3.40, the currency pair could slide to the 20-day EMA ($2.96). This is a very important support area, because if broken, the rally above $3.40 could just be a "bull trap."
Technical Analysis of BNB
BNB is witnessing a fierce struggle between the bulls and bears around the $761 region.
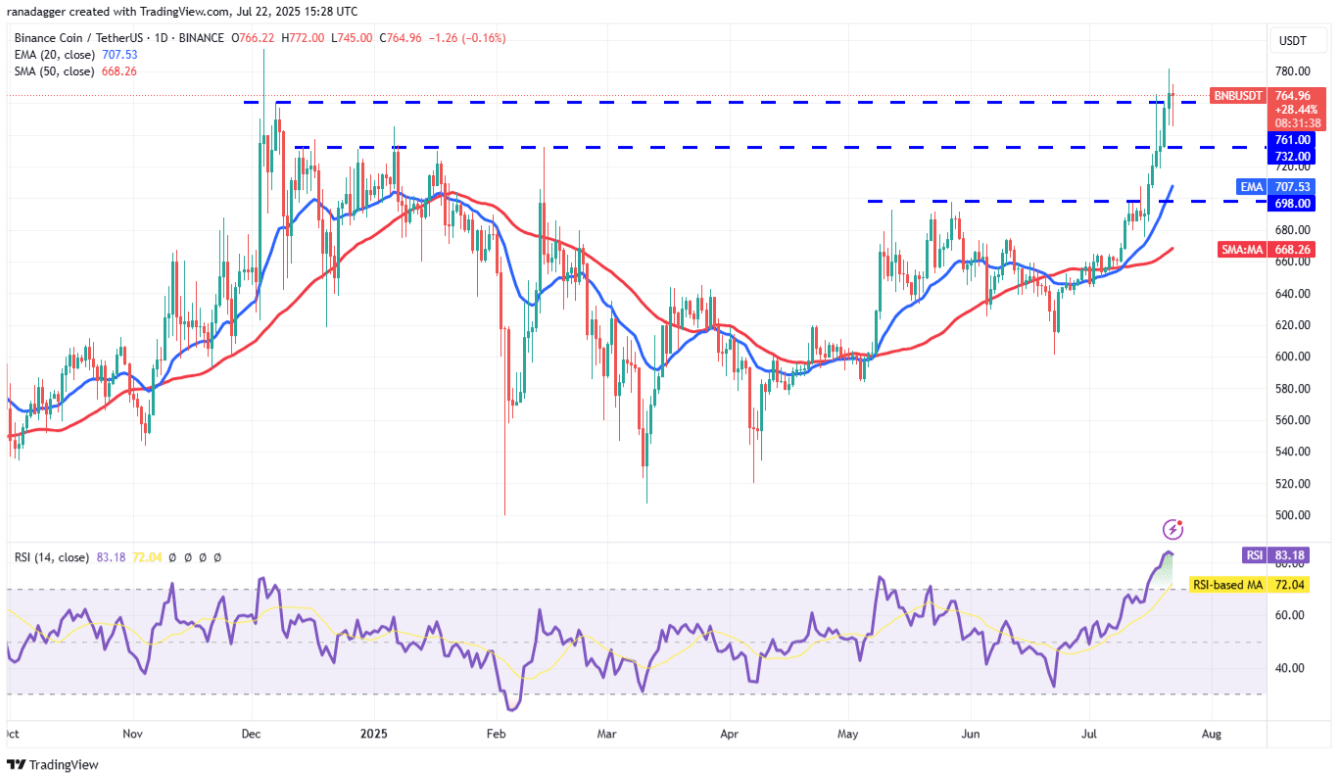
If the price closes below this level, the bears will attempt to pull the BNB/USDT pair down to $732. A strong rebound from $732 will indicate that buying interest has emerged at lower price levels. At that point, the bulls will try again to push the price above the resistance zone from $761 to $794. If successful, the upward trend could continue with a target of $900.
Conversely, if the price breaks below $732, the currency pair could drop to the 20-day EMA ($707). The bulls will need to protect this area strongly if they want to maintain their advantage.
Technical Analysis of SOL
Solana (SOL) has made a strong breakout, surpassing the important resistance at $185 on Monday, opening up opportunities for continued upward momentum. Currently, the bulls are trying to consolidate their position by pushing the price above the $209 mark – the next key barrier.
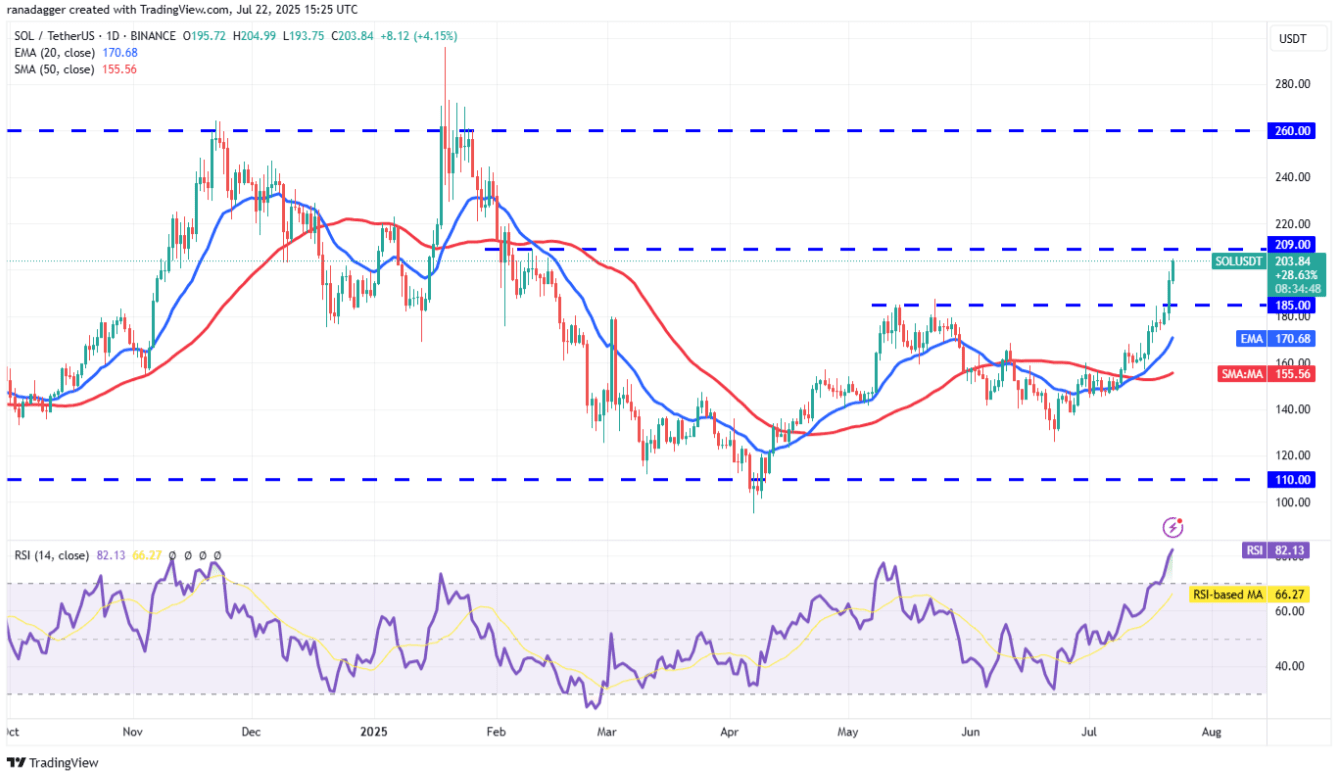
However, the RSI indicator is deep into the overbought zone, warning of a potential slight correction or a consolidation phase in the short term. If the price holds above the support of $185, it indicates that buying pressure is absorbing the dips — a positive sign that reinforces the breakout outlook above $209. In this scenario, the SOL/USDT pair could target the next levels at $220 and $240.
Conversely, if profit-taking pressure pushes the price below $185, this will confirm the exit action of short-term investors. The next support zone will be at the 20-day EMA ($170).
Technical Analysis of DOGE
Dogecoin (DOGE) broke the sideways trend with a breakout above the resistance of $0.26 on Sunday, opening a new bullish phase.
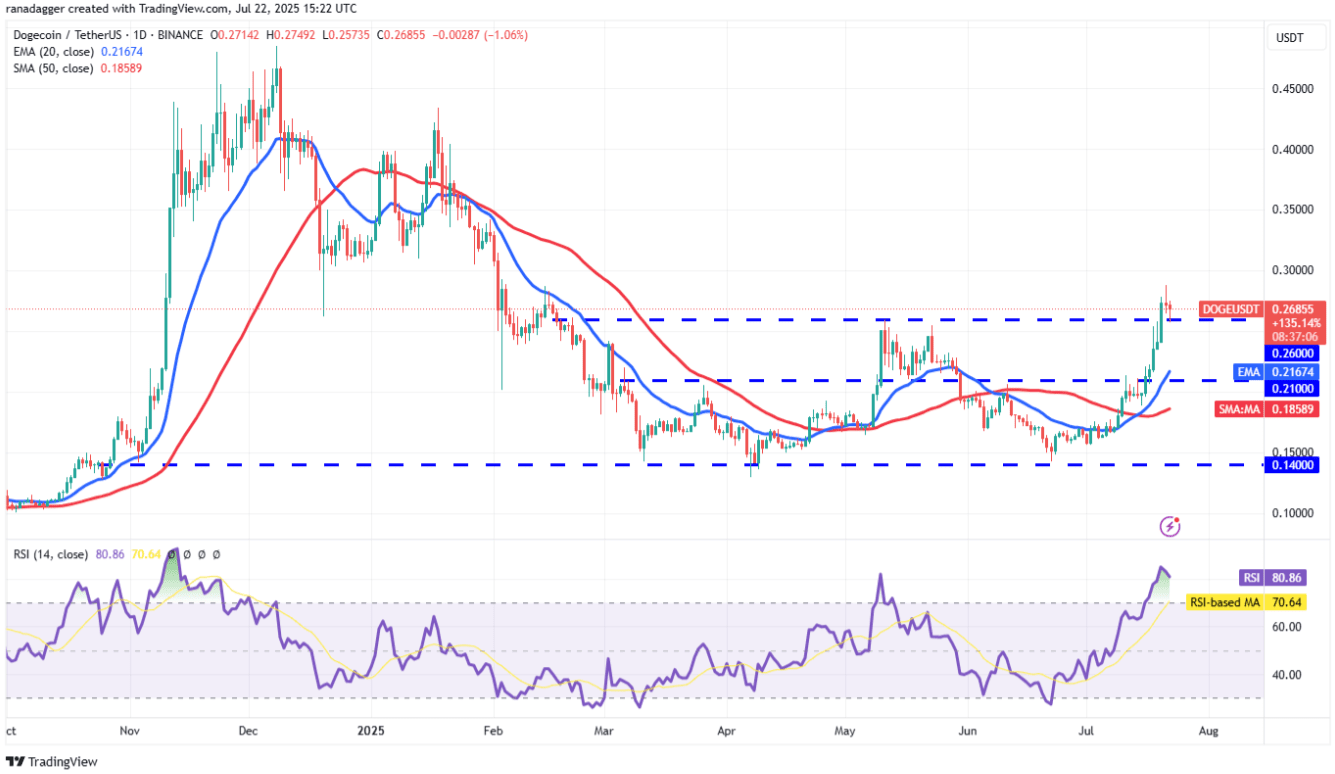
Currently, the bears are trying to pull the price back below the $0.26 mark. If successful, this could trap the chasing investors, pushing DOGE/USDT to adjust back to the 20-day EMA ($0.21) – where new buying pressure is expected to be triggered.
Conversely, if the price rebounds from the $0.26 region, it indicates that this level has turned into a support zone. Although DOGE may face light resistance at $0.29, it is highly likely that this level will be broken, pushing the price towards the target zone of $0.35.
Technical Analysis of ADA
Cardano (ADA) has surpassed the resistance of $0.86 earlier this week but is facing selling pressure as it approaches higher price levels.
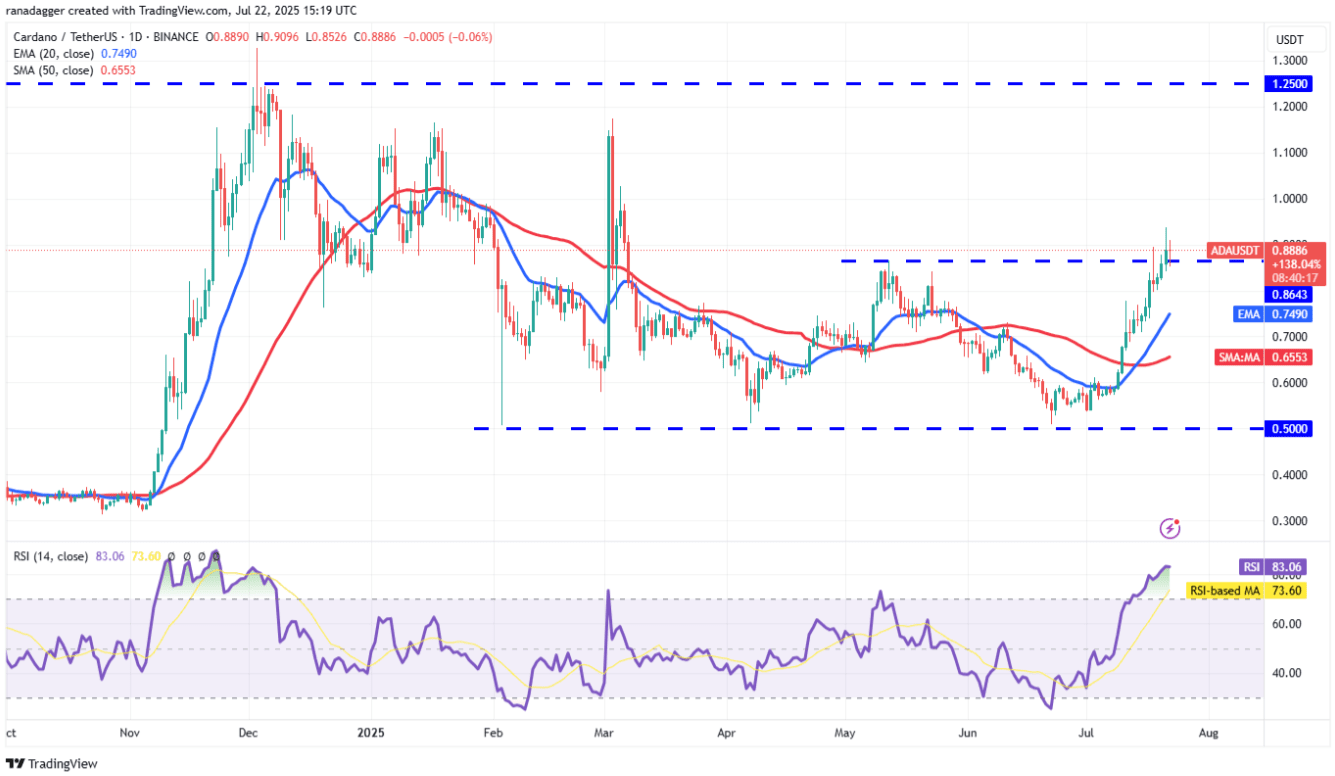
If the bears pull the price below $0.86, the ADA/USDT pair could adjust to the 20-day EMA ($0.74). This is a crucial defensive level for the bulls — as a breakdown here could extend the downward trend to the 50-day SMA ($0.65).
On the other hand, if the price holds above the 20-day EMA and rebounds, buying pressure could push ADA above the resistance of $0.94. At that point, the upward trend will be restored with targets of $1.02 and $1.17.
Technical Analysis of HYPE
Hyperliquid (HYPE) rebounded from the 20-day EMA ($43.77) on Sunday but failed to maintain the upward momentum due to profit-taking pressure emerging at high price levels.
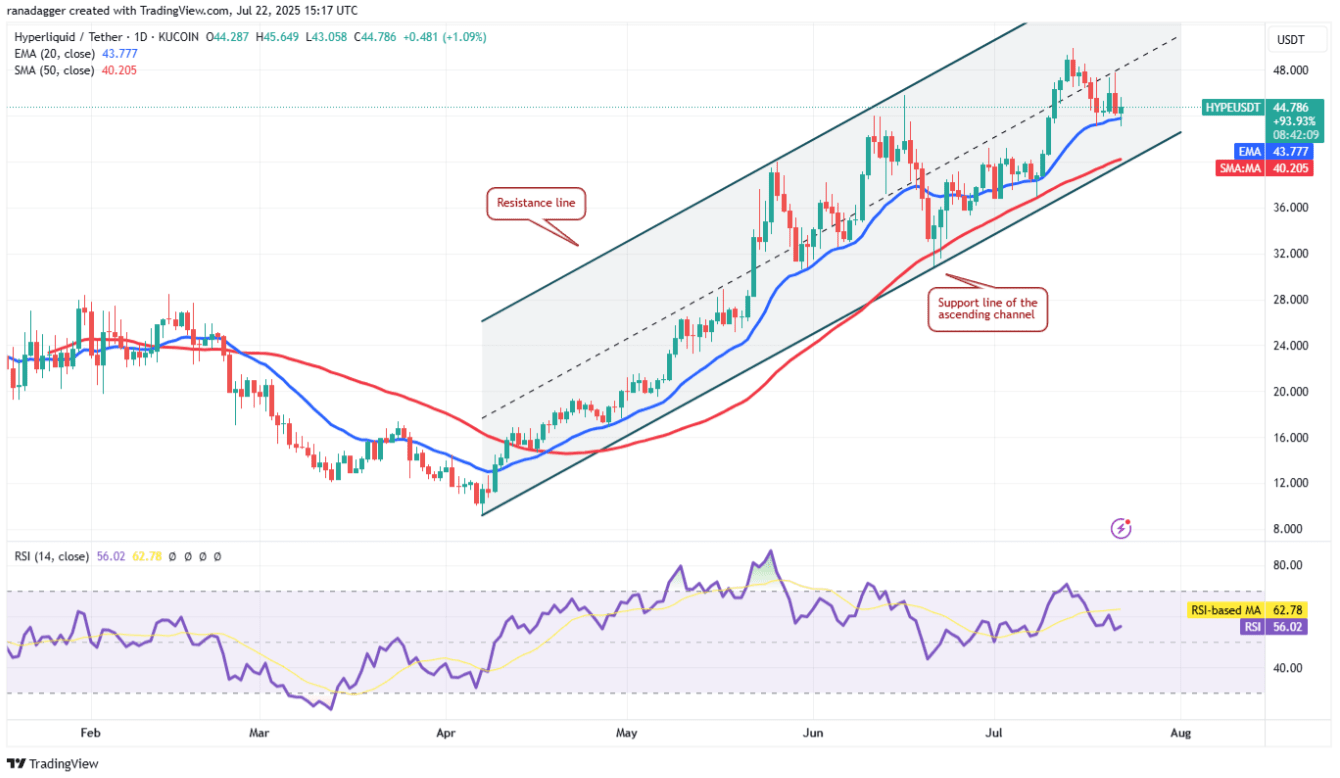
Currently, the bears are attempting to push the price below the 20-day EMA. If successful, the HYPE/USDT pair could drop significantly towards the lower support line of the rising channel.
However, if the price rebounds from the current level and surpasses the $48 threshold, it will indicate that buying pressure is returning strongly. In this scenario, HYPE is likely to head towards the upper resistance zone of the price channel, near the $58 mark.