1) Trading Plan$BTC
🟢 Buy Entry (Long)
Level Element
Entry Condition: Price bounces to R1 ≈ 119189 and tests the area with support from a 1H reversal candle.
Entry Point: 119200–119300
Target 1: 120000 (Psychological Attractor)
Target 2: 120992 (R2 Daily)
Stop Loss: 118900 (below MA15 and above 78.6% fib)
Tip: When 120000 is reached, take partial profit (~50%) and move the stop loss to 119300 to lock in profits.
🔴 Sell Entry (Short)
Level Element
Entry Condition: Price fails to hold above R2 ≈ 120000–120200 with an expanding red 1H candle.
Entry point: 119950–120000
Target 1: R1 ≈ 119189
Target 2: 118468 (61.8% fib)
Stop loss: 120300 (above the last 1H high)
Tip: If 119189 is broken downward, the correction may extend to 118098 and then 117728.
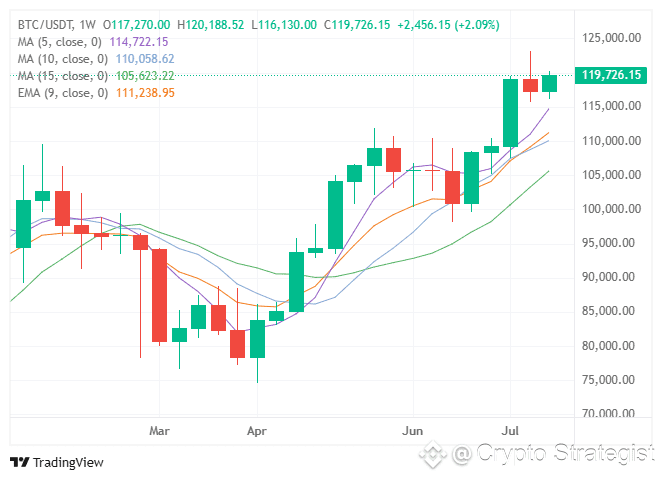
1) Summary of Recent Candles
Tier Open High Low Close Movement
Weekly 119066.19 123214.52 115776.28 117270.00 -1.51%
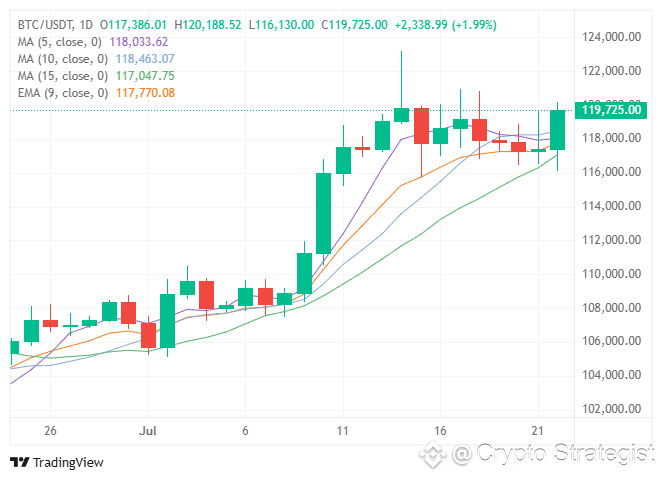
Daily 117270.00 119663.90 116532.15 117386.01 +0.10%
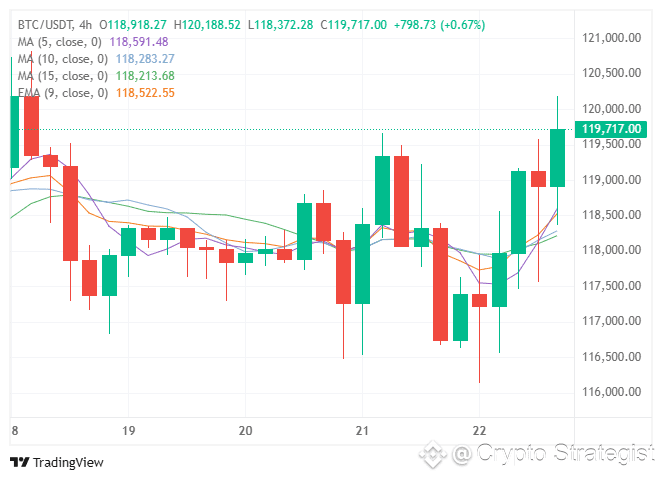
4-hour 119133.01 119584.58 117560.00 118918.27 -0.18%
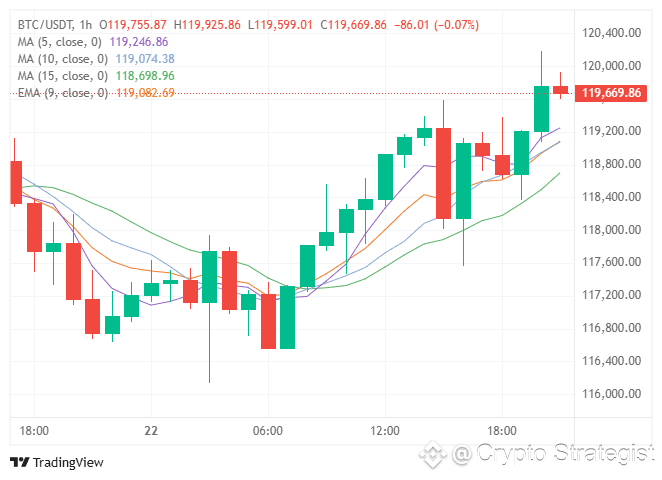
1-hour 119209.24 120188.52 119071.00 119755.87 +0.46%
Current Price — — — 119750
3) Daily Pivot Points
We took today's candlestick (1D) To calculate pivot levels:
PP = (H + L + C) / 3 = (119663.90 + 116532.15 + 117386.01) / 3 ≈ 117860.69
R1 = 2·PP – L ≈ 119189.23
R2 = PP + (H – L) ≈ 120992.44
S1 = 2·PP – H ≈ 116057.48
S2 = PP – (H – L) ≈ 114728.94
Price (≈ 119750) above R1 (≈ 119189) → Continued short-term uptrend.
4) Daily Fibonacci Levels
From the low of 116532.15 to the high of 119663.90, calculating some retracements:
23.6% @ 117271
38.2% @ 117728
50.0% @ 118098
61.8% @ 118468
78.6% @ 118990
The current price (119750) is above the highest retracement (~118990), confirming bullish strength and bringing it closer to 120K+.
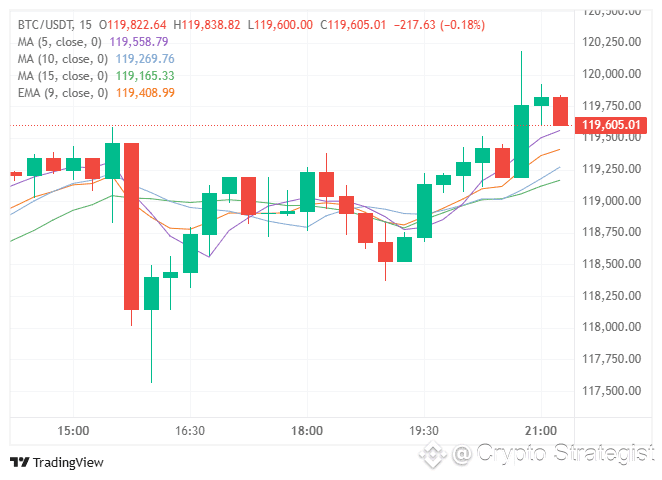
5) Technical Indicators (1H Timeframe)
RSI(14) ≈60 → healthy upward momentum and not yet oversold.
MACD(12, 26, 9) The two lines are above zero and diverging → supports the continuation of upward momentum.
EMA9/MA5/MA10/MA15 are all bullish and in order to support the price to go up (EMA9≈118523 < MA5≈118591 < MA10≈118283 < MA15≈118214).
6) Professional Tips
Confirm a 1H candle close above/below the entry levels before executing the trade.
Monitor volume: A spike in volume on a breakout/breakout confirms momentum.
Follow the news: Political or economic signals, such as interest rate data or geopolitical tensions, can abruptly change the movement.
Risk Management: Don't risk more than 1–2% of your capital on a single trade.
Conclusion: Bitcoin is successfully testing the daily resistance at 119,189 and retesting it as support. A soft entry at 119,200 could target 120,000+, while a failure to hold above 120,000 will push the price toward lower Fibonacci levels.
Good luck with your trading! 🚀$ETH $BNB
#ETHBreaks3700 #StablecoinLaw #StrategyBTCPurchase #BinanceHODLerERA #PowellVsTrump