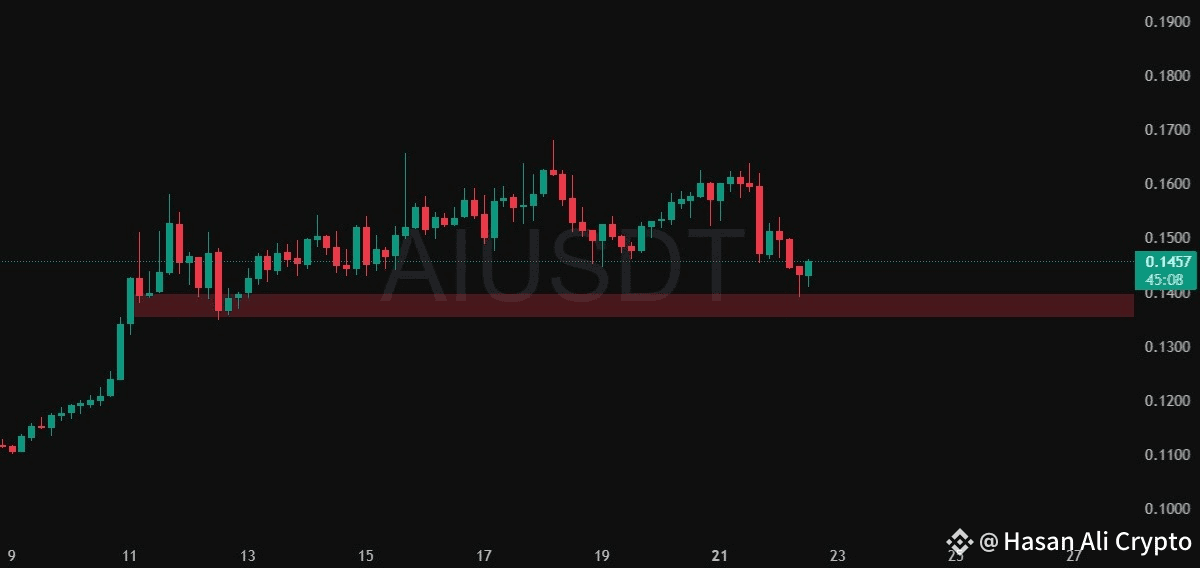
It is currently testing a key support zone around 0.1390–0.1430 USDT (marked in red).
The latest candle shows a rejection wick from this support zone, indicating buying pressure.
Momentum is slowing down on the downside, and buyers are starting to show interest again.
Support Zone:
Strong demand around 0.1390–0.1430 USDT, tested multiple times.
Resistance Levels:
Minor resistance at 0.1500–0.1530 USDT.
Next key resistance near 0.1600 USDT.
Candle Pattern:
Potential bullish reversal candle (long wick rejection) from support zone.
---
💡 Intraday Trading Signal (Buy Setup)
🟢 Trade Type: Long (Buy)
⏰ Timeframe: 4H (Intraday swing)
---
✅ Entry Zone:
Buy between 0.1440 – 0.1460 USDT
🛑 Stop Loss (SL):
Below the support zone:
→ SL at 0.1375 USDT (Just below the lower bound of the demand zone)
🎯 Take Profit Targets:
TP1: 0.1500 USDT (near minor resistance)
TP2: 0.1575 USDT (swing high area)
TP3 (Optional for runners): 0.1650 USDT (if momentum picks up)
---
⚖️ Risk-Reward Ratio:
TP1: ~1:1
TP2: ~2:1
TP3: ~3:1+
---
🔄 Alternative Scenario (Invalidation):
If price closes strongly below 0.1380 USDT on the 4H chart, bullish setup invalidates.
In that case, wait for a fresh setup or breakdown retest for shorting opportunities.
---
📌 Summary:
Parameter Value
Trade Direction Long (Buy)
Entry Zone 0.1440 – 0.1460 USDT
Stop-Loss 0.1375 USDT
Take-Profit 1 0.1500 USDT
Take-Profit 2 0.1575 USDT
Take-Profit 3 0.1650 USDT (Optional)