Five high-probability MACD patterns
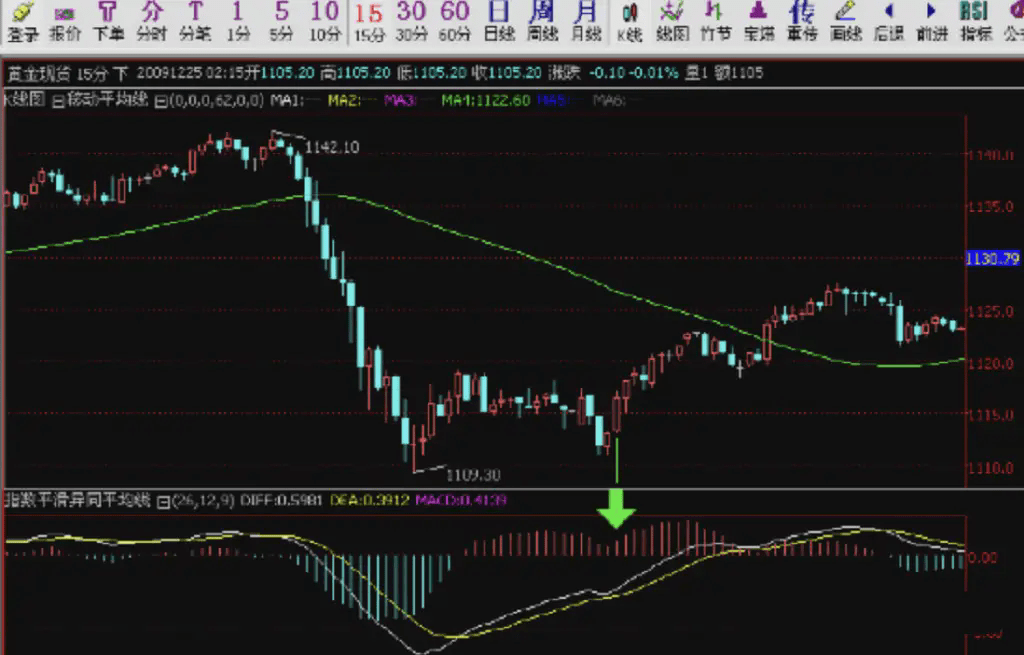
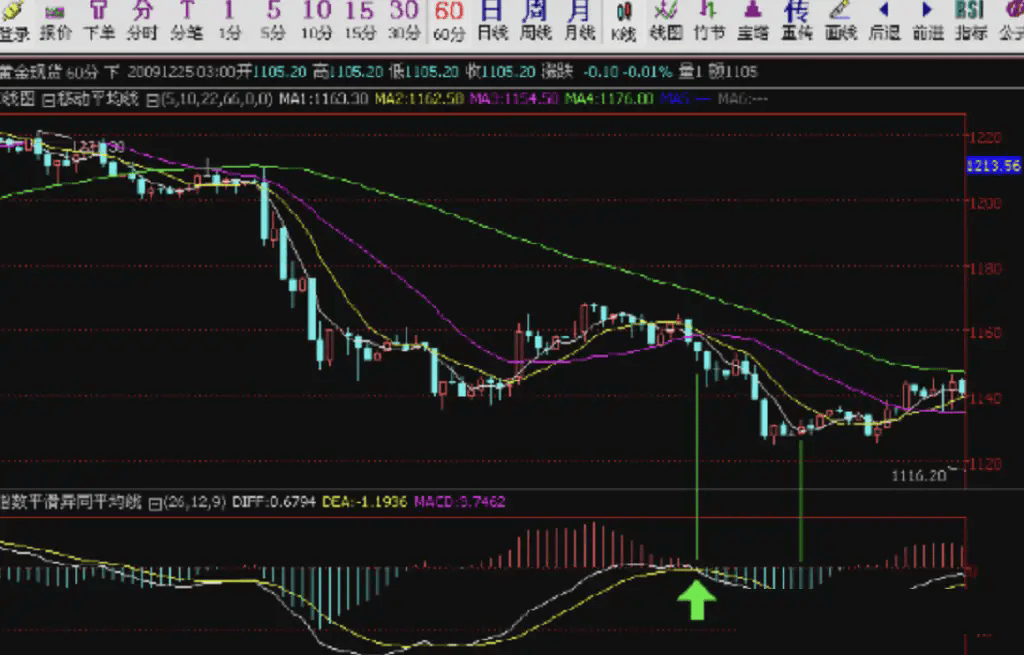
1. The first golden cross above the 0 axis, the first death cross below the 0 axis.
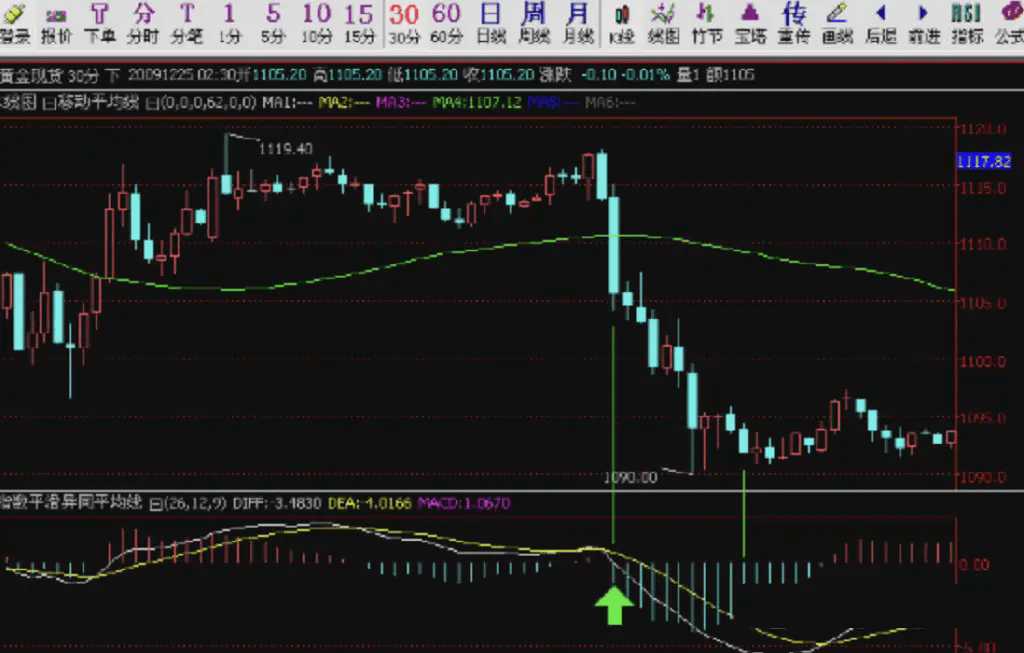
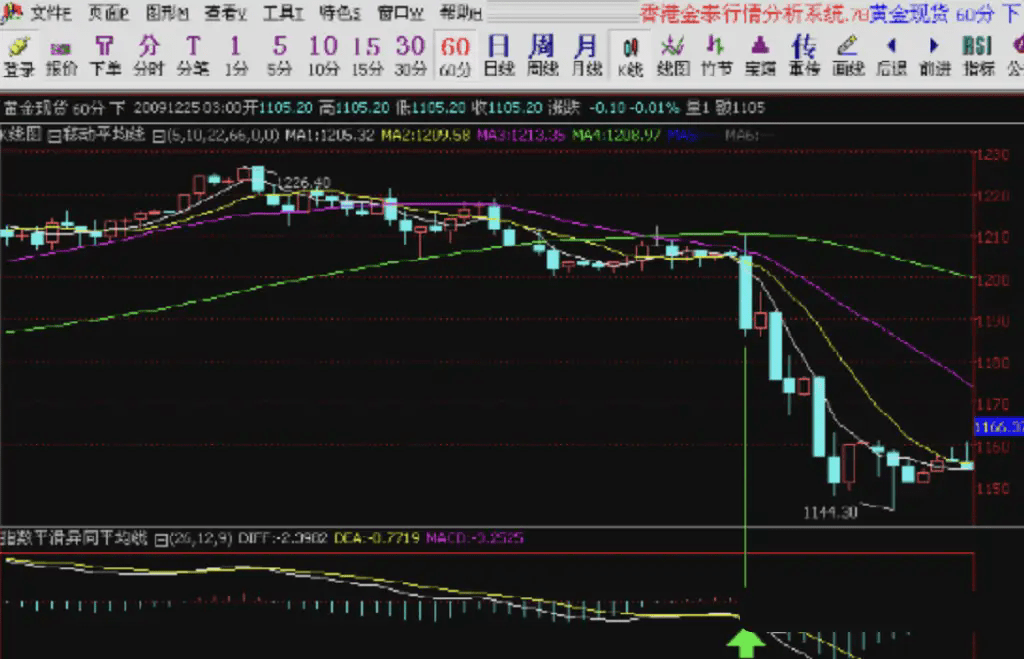
Applied in hourly charts. Operate only on the first golden cross above the 0 axis, and only on the first death cross below the 0 axis. Enter based on the smaller cycle's pattern. If the hourly MACD bars do not expand and shrink, pay attention to the patterns in the 30-minute cycle, look at the patterns for exit, and the stop-loss also depends on the pattern. Generally, entering such a pattern means a small profit, but there can be a large pullback afterward.
If backtracking leads to 30 minutes exhaustion or death cross, then stop-loss and exit. Otherwise, hold the position, as the hourly wave will have at least 100 points of movement. During volatile periods, special patterns can lower profits, to be managed by oneself.
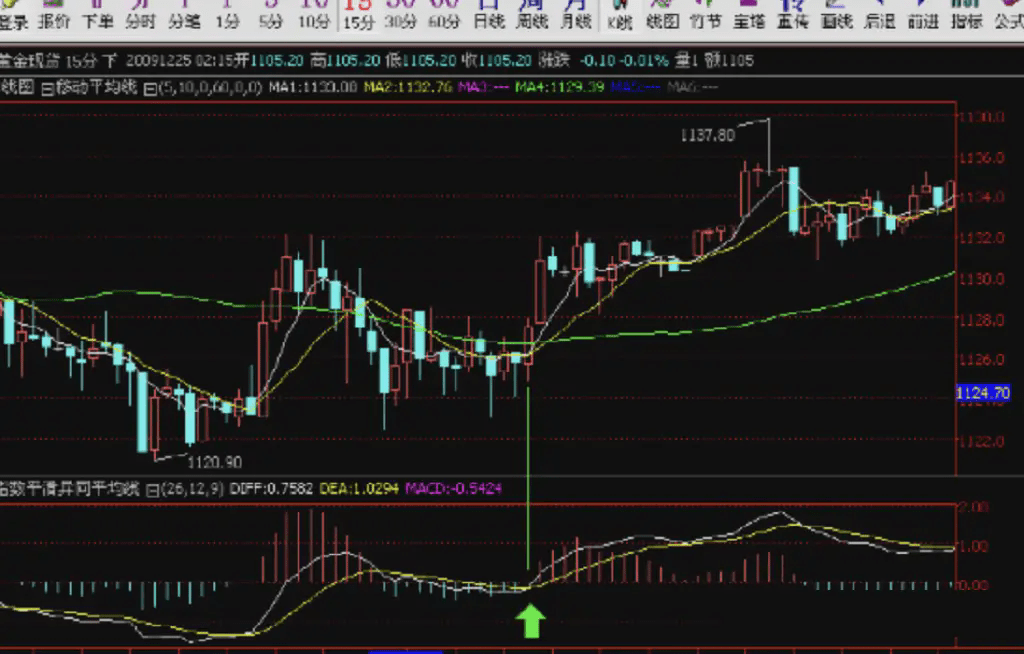
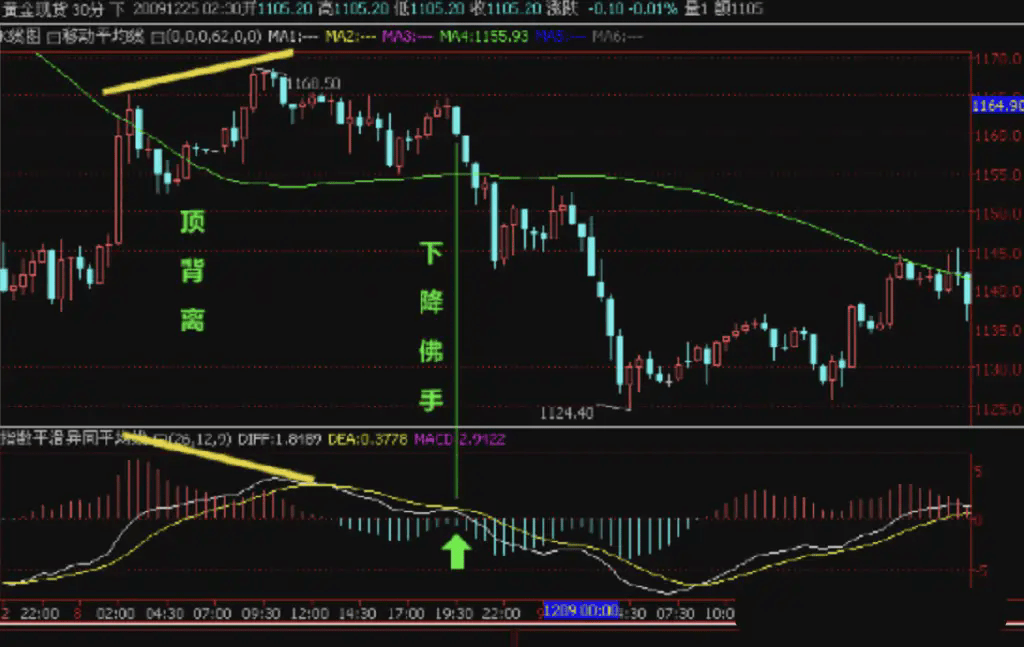
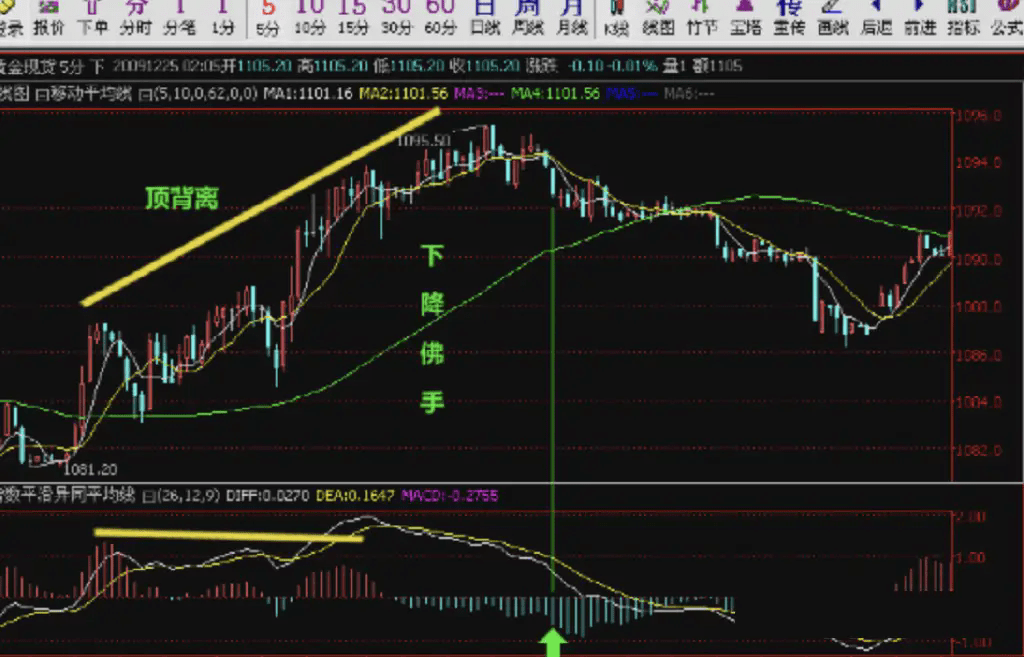
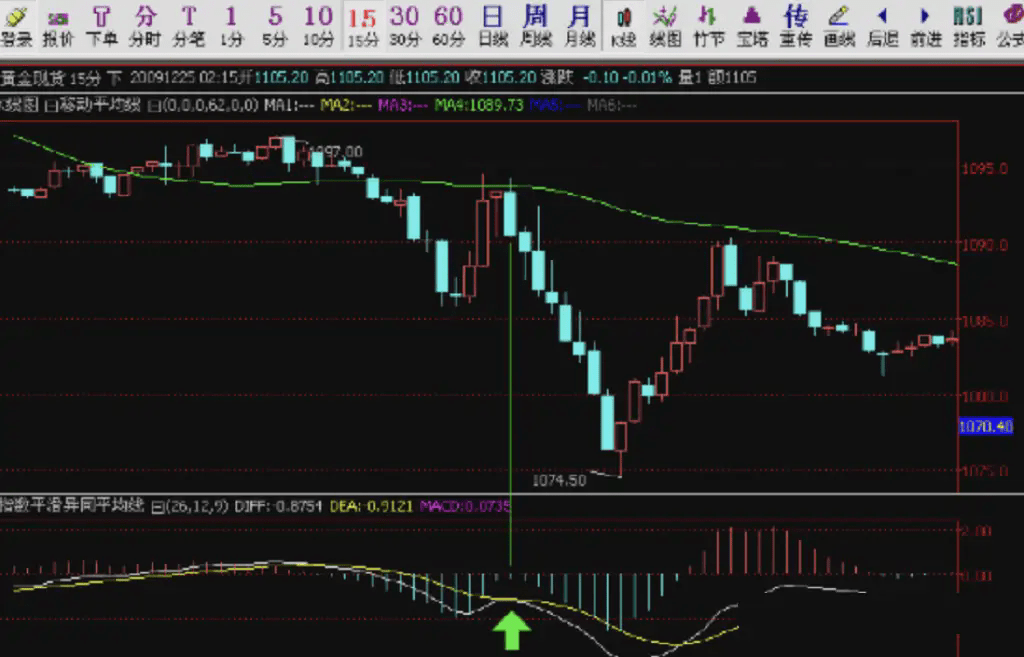
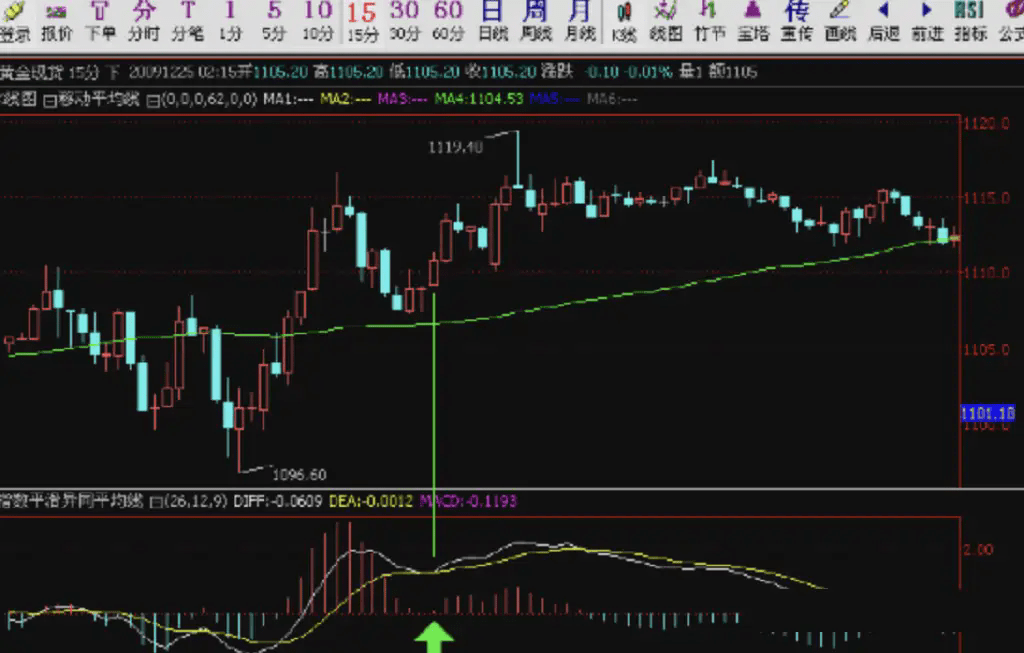
2. Divergence plus Buddha Hand
Divergence plus Buddha Hand is also a classic trading signal, for example as follows.
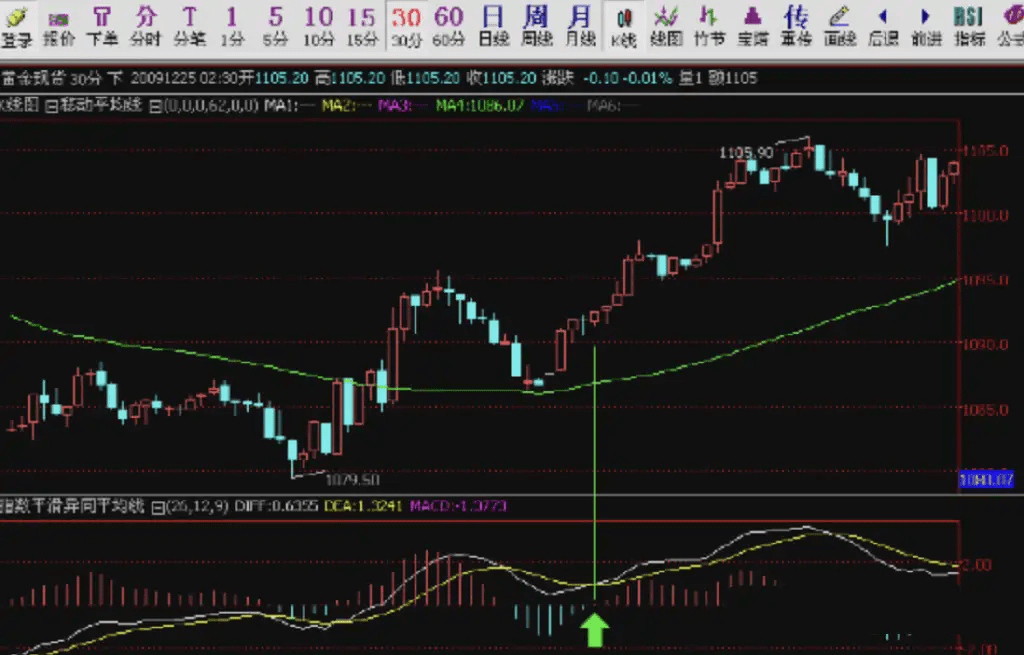
3. Dragonfly Doji
1. A different bar appears among red bars or green bamboo, then continue in the direction of the previous bars.
2. Ideally, there should be 1 bar, not exceeding 3 bars.
3. This pattern is used for rebound bottom-fishing, with the stop-loss being the low point of the water drop.
To increase trading opportunities, one can choose to form water drop patterns in 5 minutes. If aiming for larger waves, then do it in 15 minutes. The stop-loss should be set based on the current market situation and personal risk tolerance, usually set at the lowest point of the water drop candlestick.
Take profit targets generally break new highs for trend-following points, while the first target for counter-trend points is the previous high or low, depending on the situation.
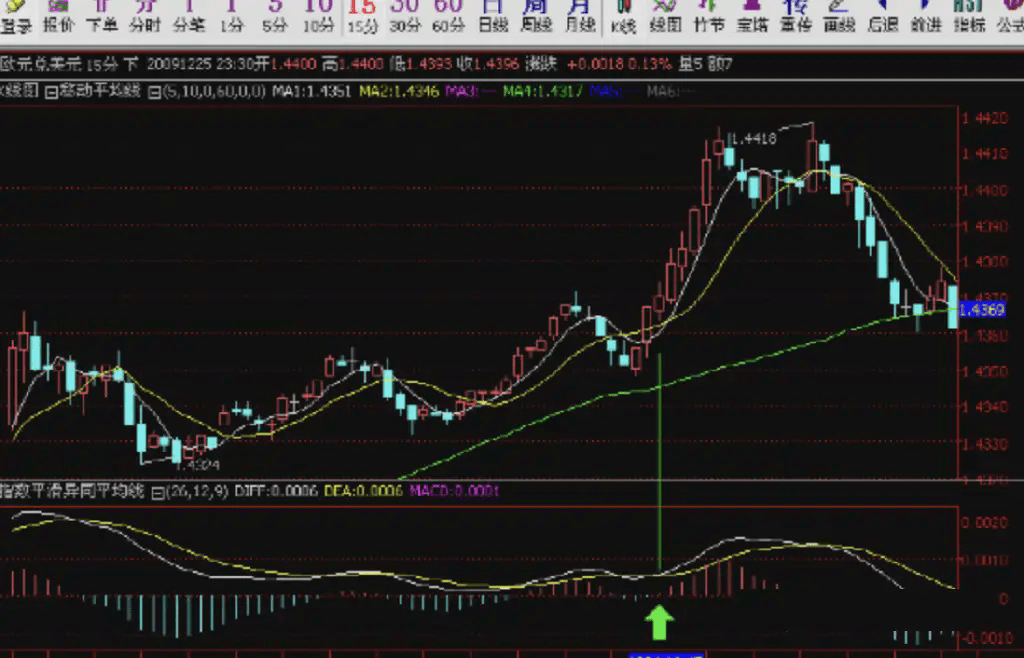
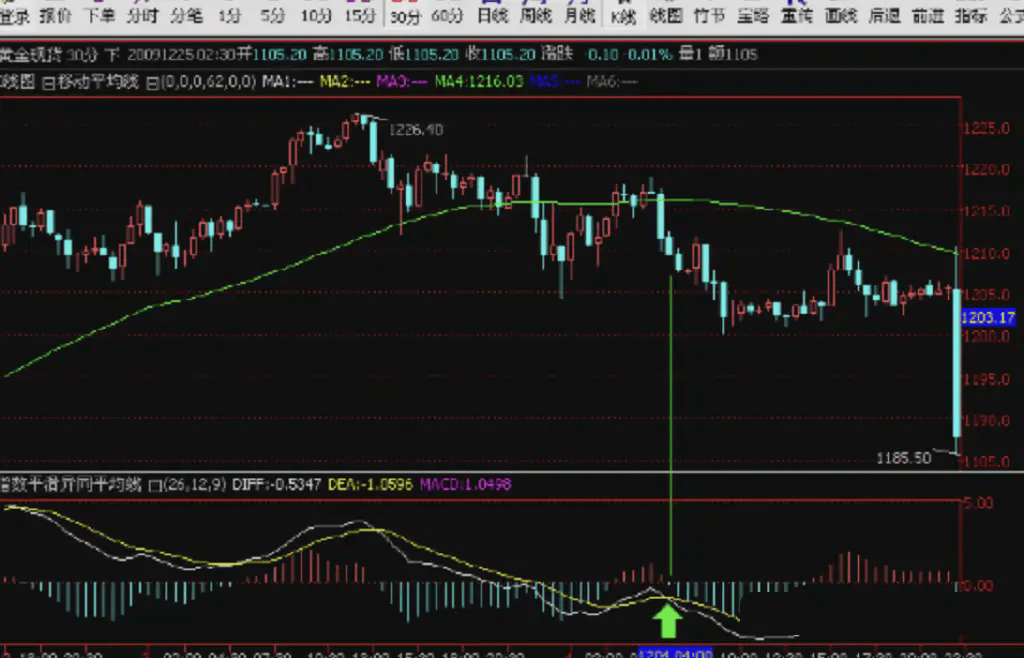
4. Buddha Hand
Buddha Hand pattern, when the MACD fast and slow lines intersect at high or low levels and the market does not move in the opposite direction but continues in the previous direction, or moves sideways for a while, then the bars expand in the direction of the intersection. Expanding bars signal a breakout and are also our entry point for operations. The exit signal also refers to when the bars detach from the slow line as the main reference.
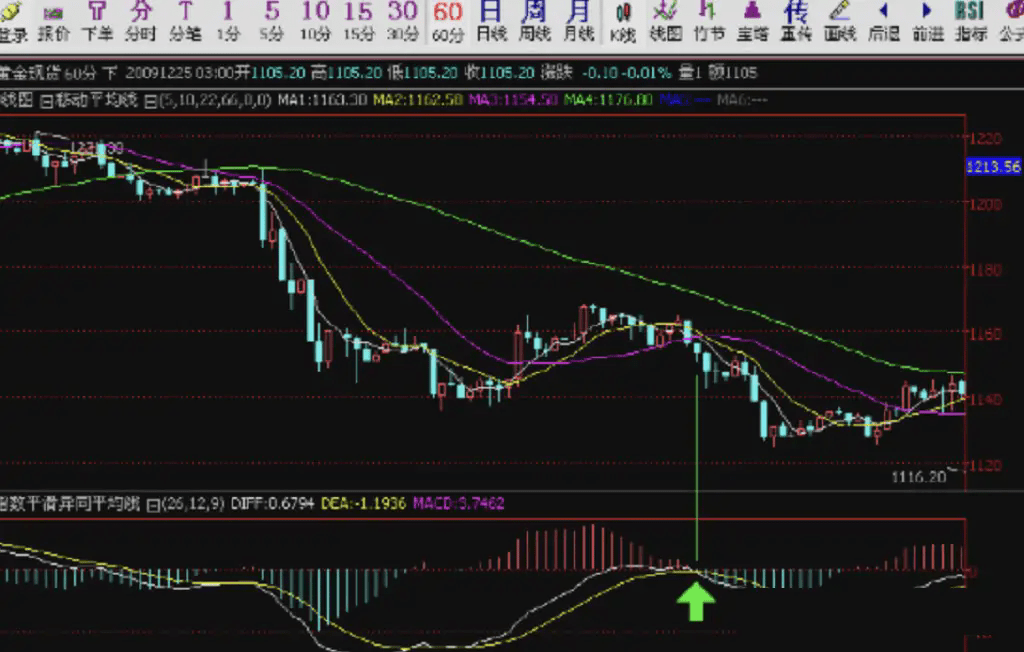
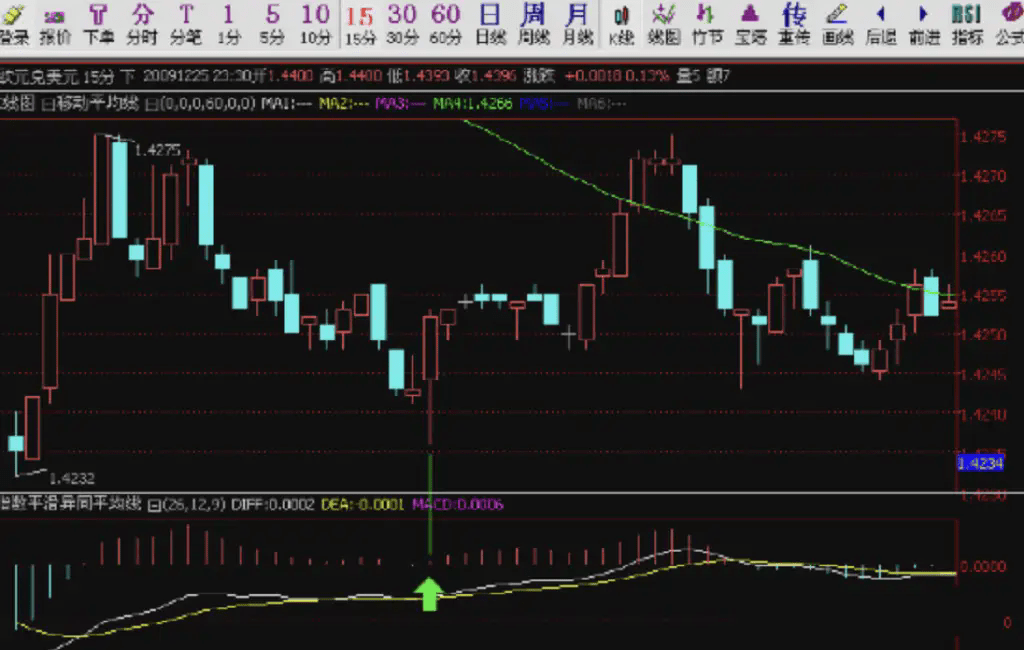
5. Cutting the Head and Tail
1. Fast and slow lines must be close to the 0 axis.
2. When the bars appear, the best first bar should start moving against the line.
Exit signal:
◇ When the bars detach from the fast line, it is the first signal.
◇ When the bars detach from the slow line, it is a necessary exit signal.
The name comes from the fact that this pattern appears after a segment of market movement. This is the cut-off head; after exiting, there is often another segment of movement, which is the cut-off tail. Regardless, when encountering this pattern, one must exit according to the exit signal.
Strong rebound, asset doubling! Keep up with nostalgia, layout in advance, easily achieve big profits.
Continued attention: SPK FIDA