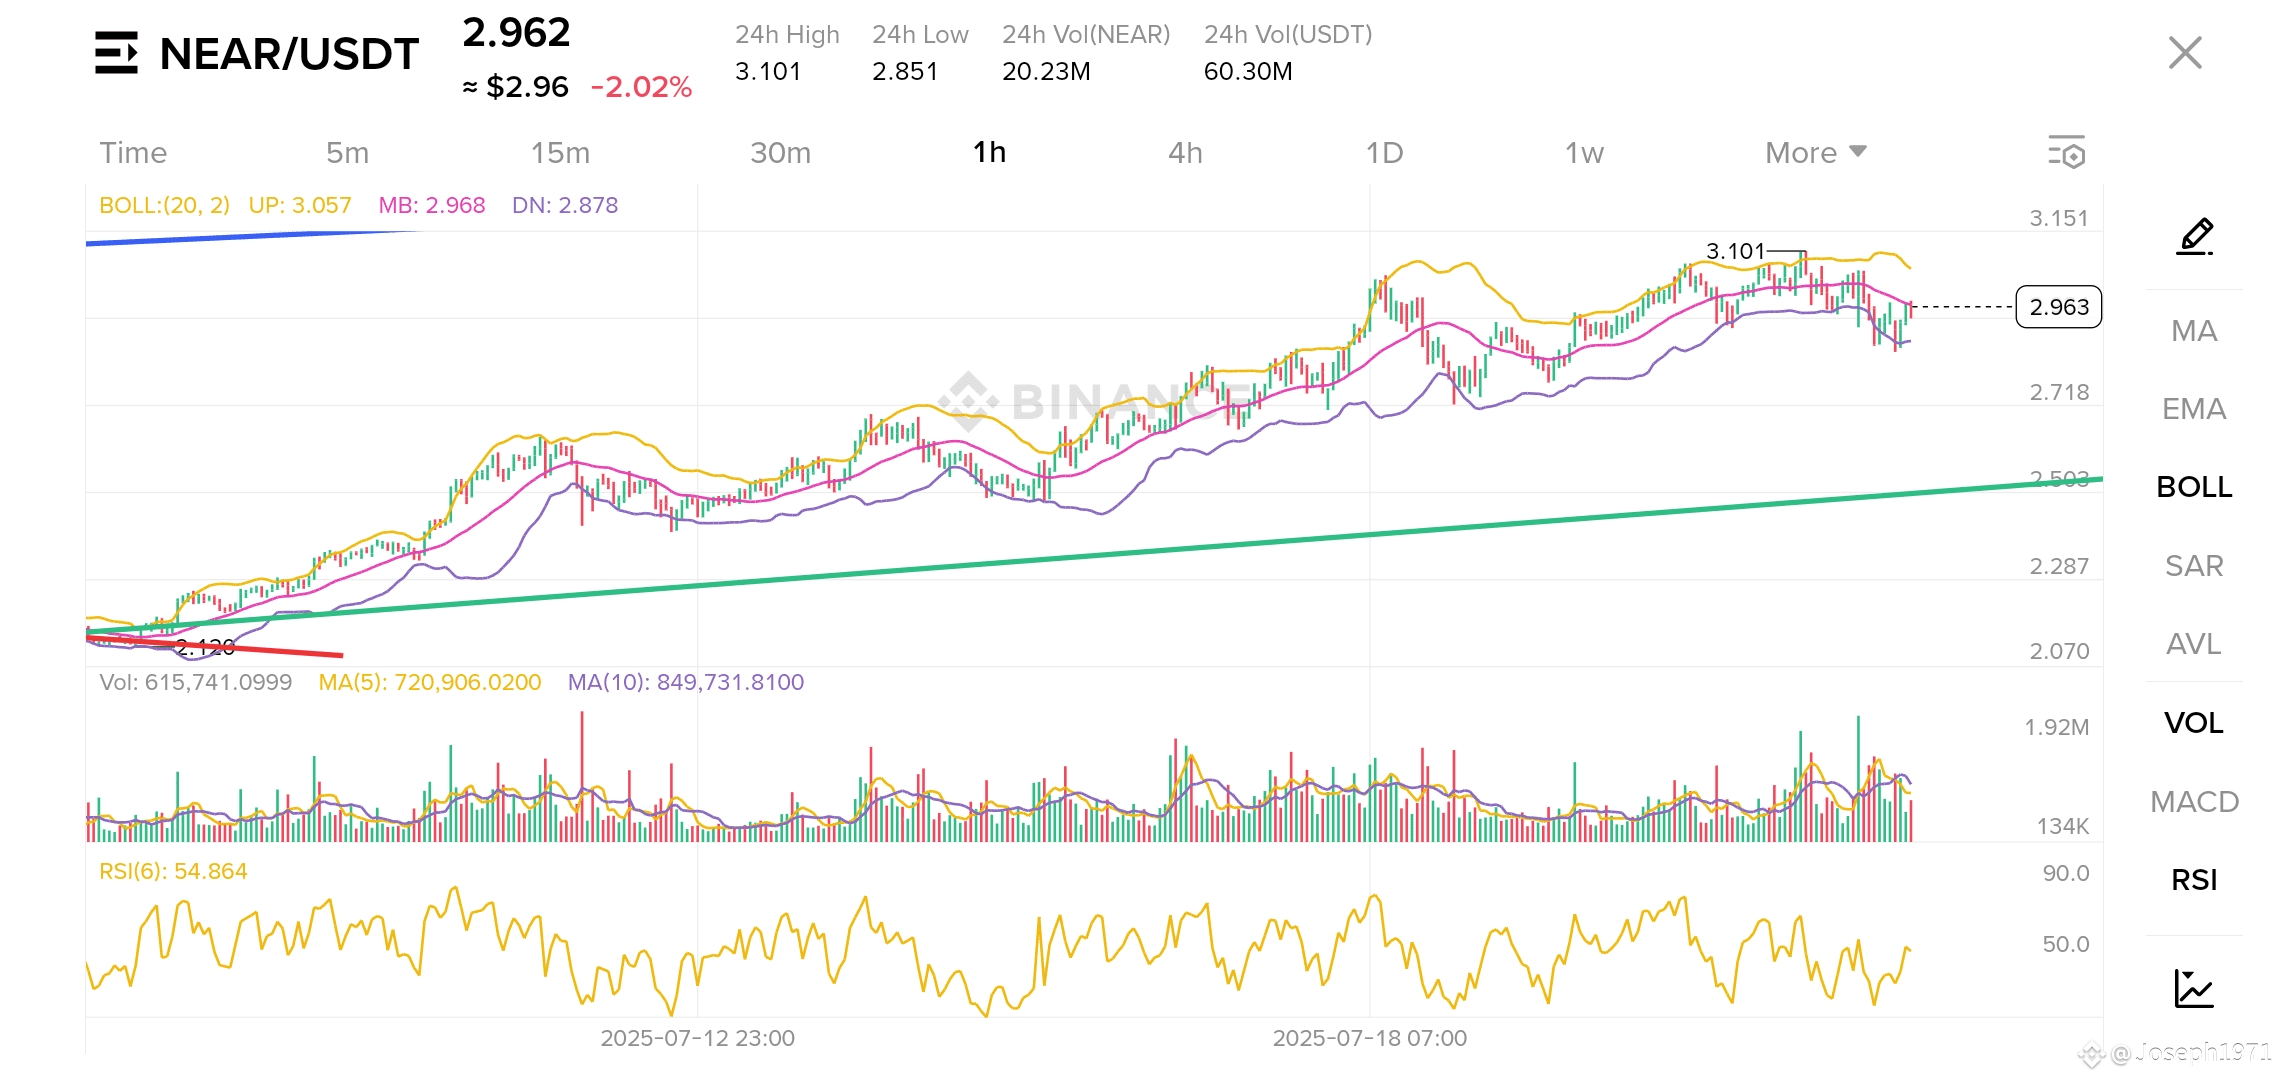
Current NEAR Price: $2.962 (as displayed in the top left corner).
NEAR Protocol (NEAR) Chart Analysis (1-Hour Timeframe)
1. Price Action and Trend:
* Consolidation after Rally: The chart shows NEAR has been in a consolidation phase after its strong rally to a high of $3.101. The price has pulled back and is now moving sideways within a range.
* Range: The recent price action is oscillating between approximately $2.851 (low) and $3.101 (high).
* Broader Uptrend: Despite the current consolidation, the overall trend from the lower left of the chart (around July 12th) appears to be a broader uptrend, with the price generally making higher lows, supported by the visible green ascending trendline.
2. Bollinger Bands (BB):
* UP (Upper Band): $3.057
* MB (Middle Band - 20 SMA): $2.968
* DN (Lower Band): $2.878
* Observation: The current price ($2.962) is trading just below the Middle Bollinger Band. The bands themselves appear to be contracting, which indicates a period of decreasing volatility and tightening consolidation. This often precedes a larger price move.
3. RSI (Relative Strength Index):
* RSI(14): 54.864
* Observation: The RSI is hovering just above the 50 mark, indicating neutral to slightly bullish momentum. It's not in overbought or oversold territory, reflecting the current consolidation.
4. Volume:
* The volume bars show periods of higher volume during the initial rally and during sharp moves within the consolidation, but generally, volume appears to be relatively subdued during the tightest parts of the sideways movement, which is typical for consolidation.
Overall Outlook for NEAR:
Based on this 1-hour chart and integrating our previous discussions:
* Consolidation Phase: NEAR is currently in a consolidation phase following a significant rally. This is a healthy development, allowing the price to cool off after an upward surge.
* Indecision (Short-Term): The price is oscillating around the middle Bollinger Band and RSI is neutral, suggesting a short-term indecision as buyers and sellers battle for control within the tightening range.
* Underlying Bullish Bias: However, the broader trend remains bullish (supported by the green ascending trendline, and the overall macro environment with BTC at ATHs). The contracting Bollinger Bands suggest volatility is decreasing before a potential new directional move.
* Next Move: The resolution of this consolidation (a breakout either above $3.101 or a breakdown below $2.851) will dictate NEAR's immediate next move. Given the broader context, a breakout to the upside is still the more probable outcome, as it aligns with the overall bull market and NEAR's daily chart's bullish structure.
In summary, NEAR is currently in a temporary holding pattern after a strong run. It's consolidating, building energy for its next move, with a prevailing bullish bias.