,
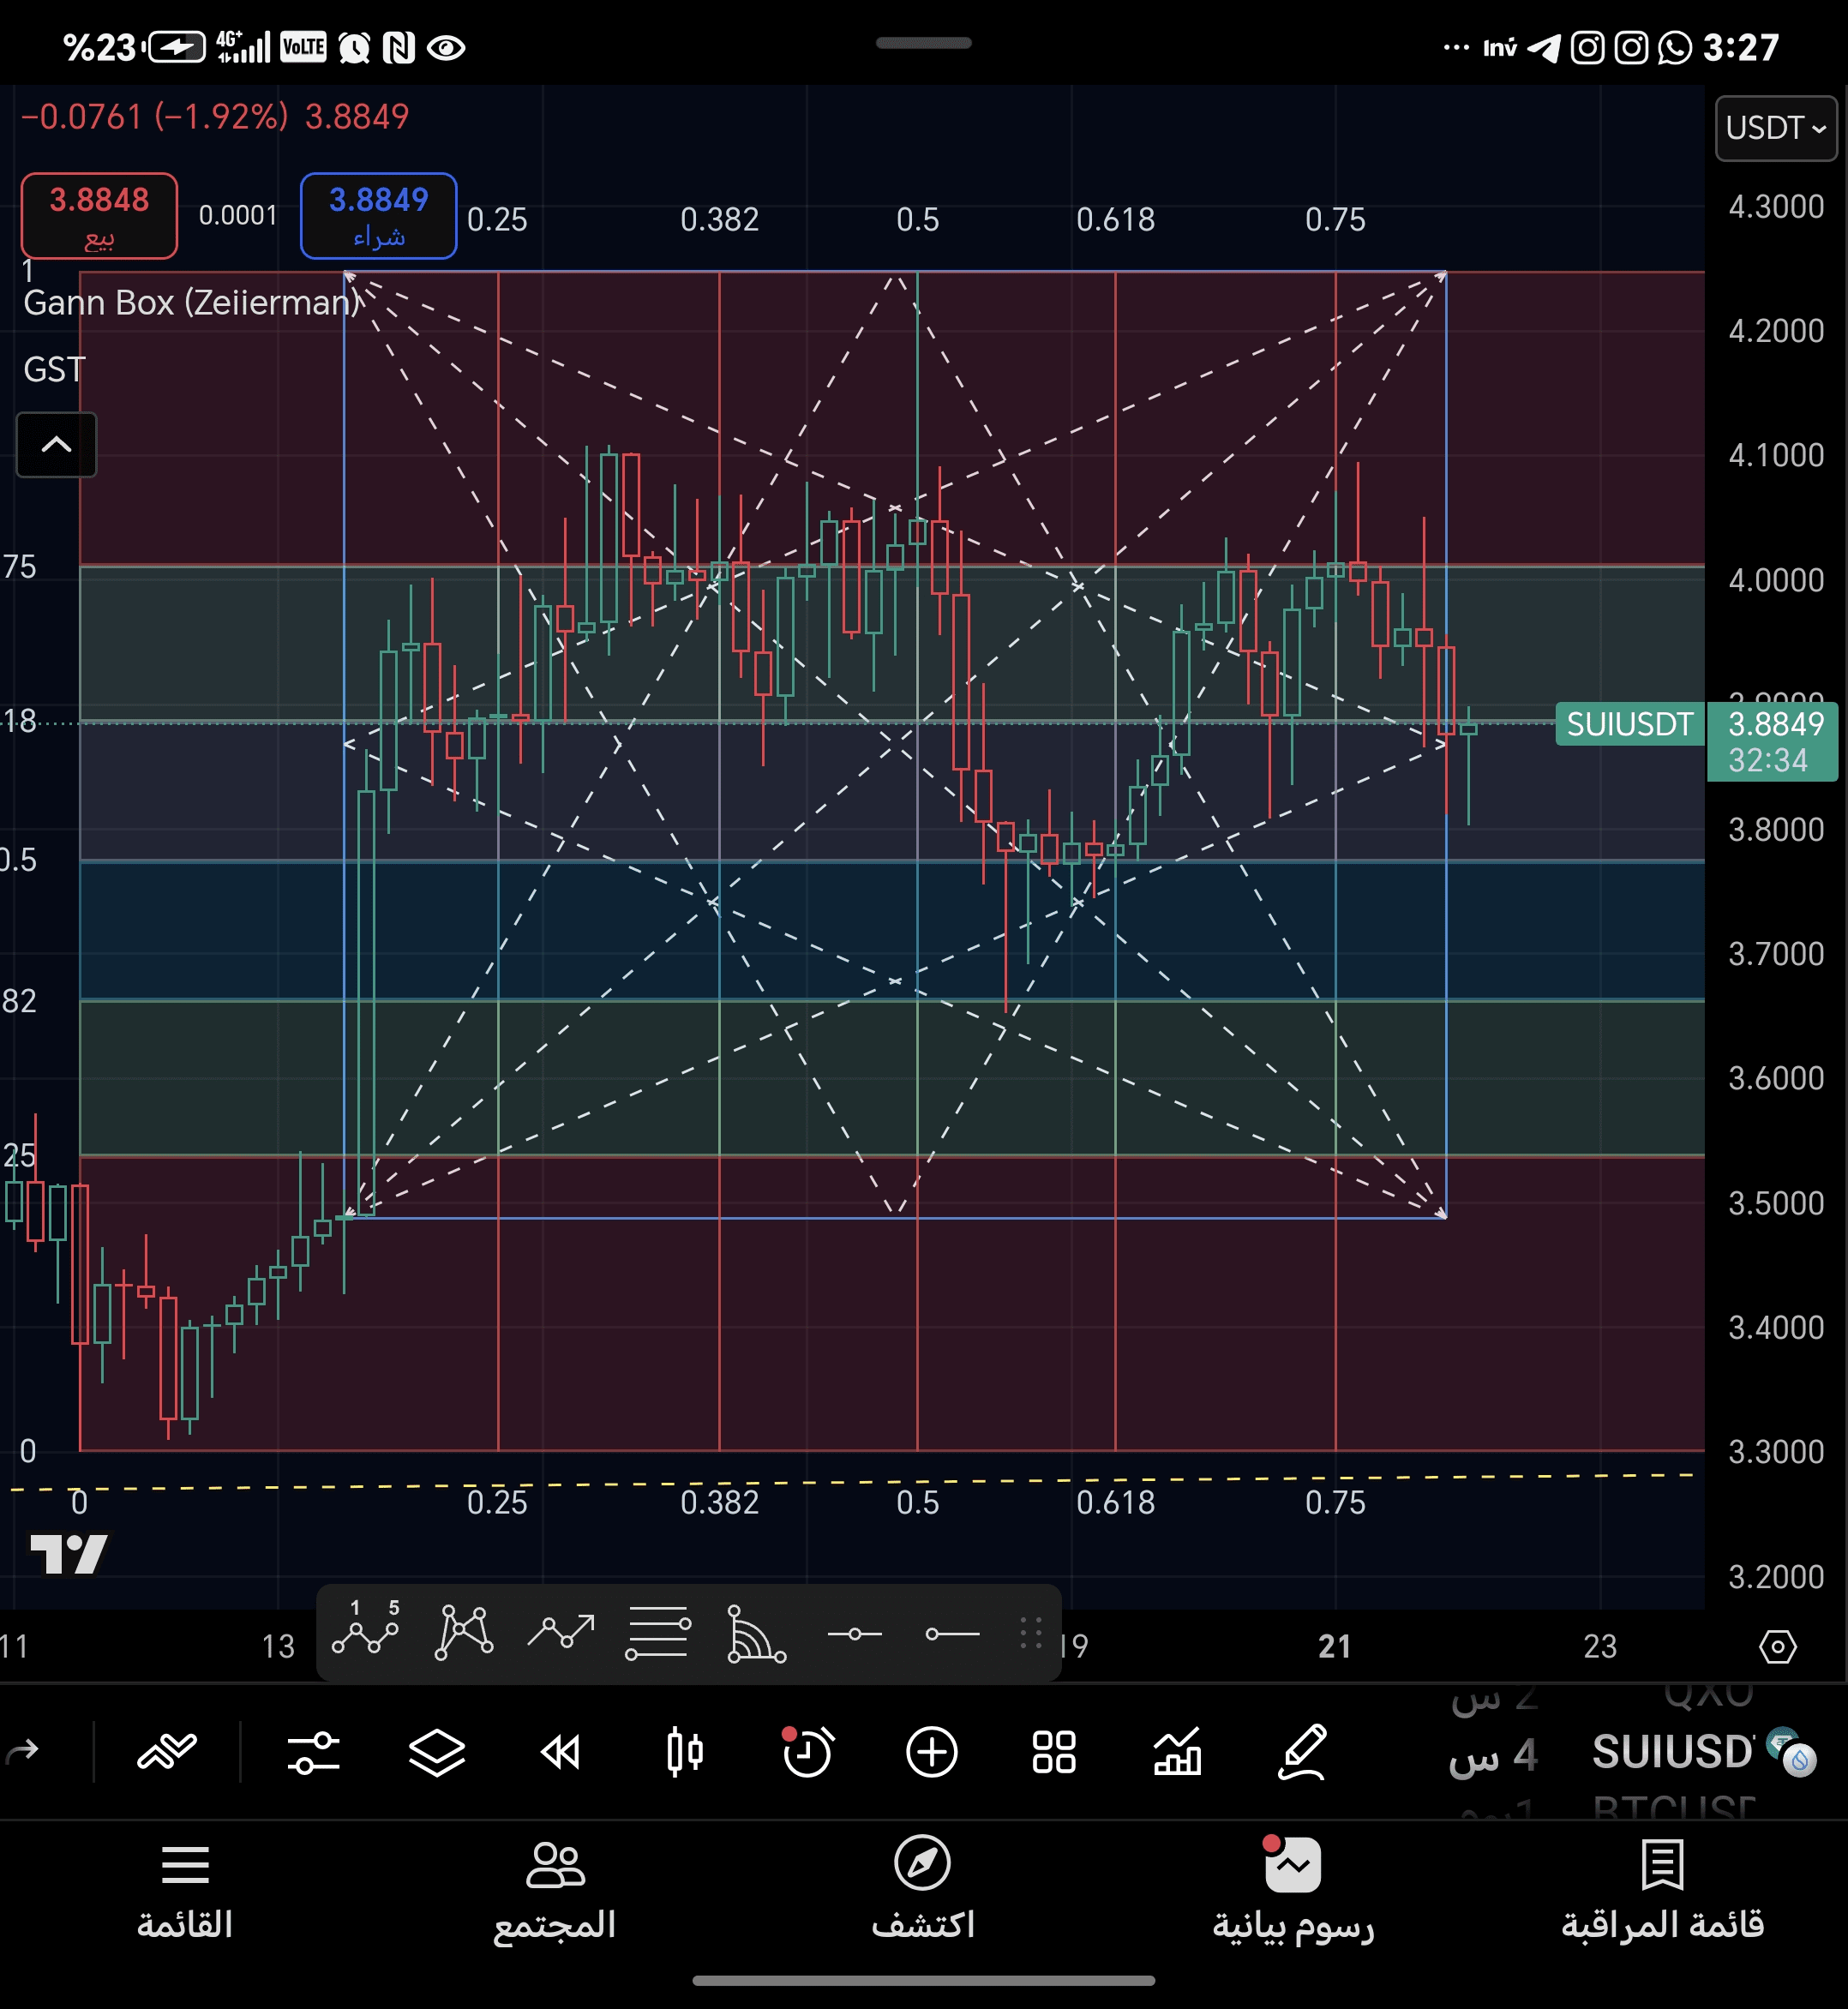
🧠 Technical analysis for SUI/USDT - 4-hour frame
🔹 Current Price: 3.8849 USDT
🔻 Change Rate: -1.92%
🔹 Condition: Sideways movement within a defined range (Sideways Consolidation)
📐 Gann Box analysis and price trend:
The Gann Box is drawn between the bottom 3.25 and the top 4.25, providing a clear analytical range within geometric and temporal dimensions.
The price is moving horizontally within a clear fluctuation area between 3.75 – 4.10 USDT.
The inability of the price to break 4.10 or 3.75 indicates a stage of accumulation or hesitation from the market.
🔼 Resistance Areas:
4.05 – 4.10 USDT:
Strong resistance where reversals occur, representing the ceiling of the sideways range.4.25 USDT:
The current peak in the Gann Box, breaking it indicates the beginning of a new upward wave.
🔽 Support Areas:
3.75 – 3.80 USDT:
Medium support in the middle of the box, tested multiple times.3.60 USDT:
Stronger support, representing the 0.382 level of the Gann Box.3.25 USDT:
Critical support and main bottom.
🔁 Price Behavior:
The price is moving within a sideways channel, indicating accumulation before the next movement.
Long-tailed candles below indicate demand and buying during the drop.
The absence of a decisive break means the market is waiting for news or an external catalyst to move.
📊 Potential Technical Indicators:
The indicator reading potential interpretation RSI around 50 not overbought or oversold - neutral MACD weak or sideways crossover reflects volatility and non-direction Volume low and volatile agrees with accumulation state
📈 Expected Scenarios:
🟢 Upward Scenario:
Breakthrough 4.10 USDT firmly pushes the price to:
4.25 (Peak)
then 4.50 – 4.70 as extended targets.
🔴 Downward Scenario:
Break3.75 USDT pushes the price to:
3.60 (Strong Support)
3.25 (Critical Support)
🧭 Summary:
The currency is in sideways accumulation within a defined channel.
No decision until a clear break of one of the sides (4.10 or 3.75).
Volatility can be exploited for speculation, buying at support and selling at resistance.
Stop loss in case of breaking 3.60 with a 4-hour candle.