:
🧠 Technical Analysis (4 Hours):
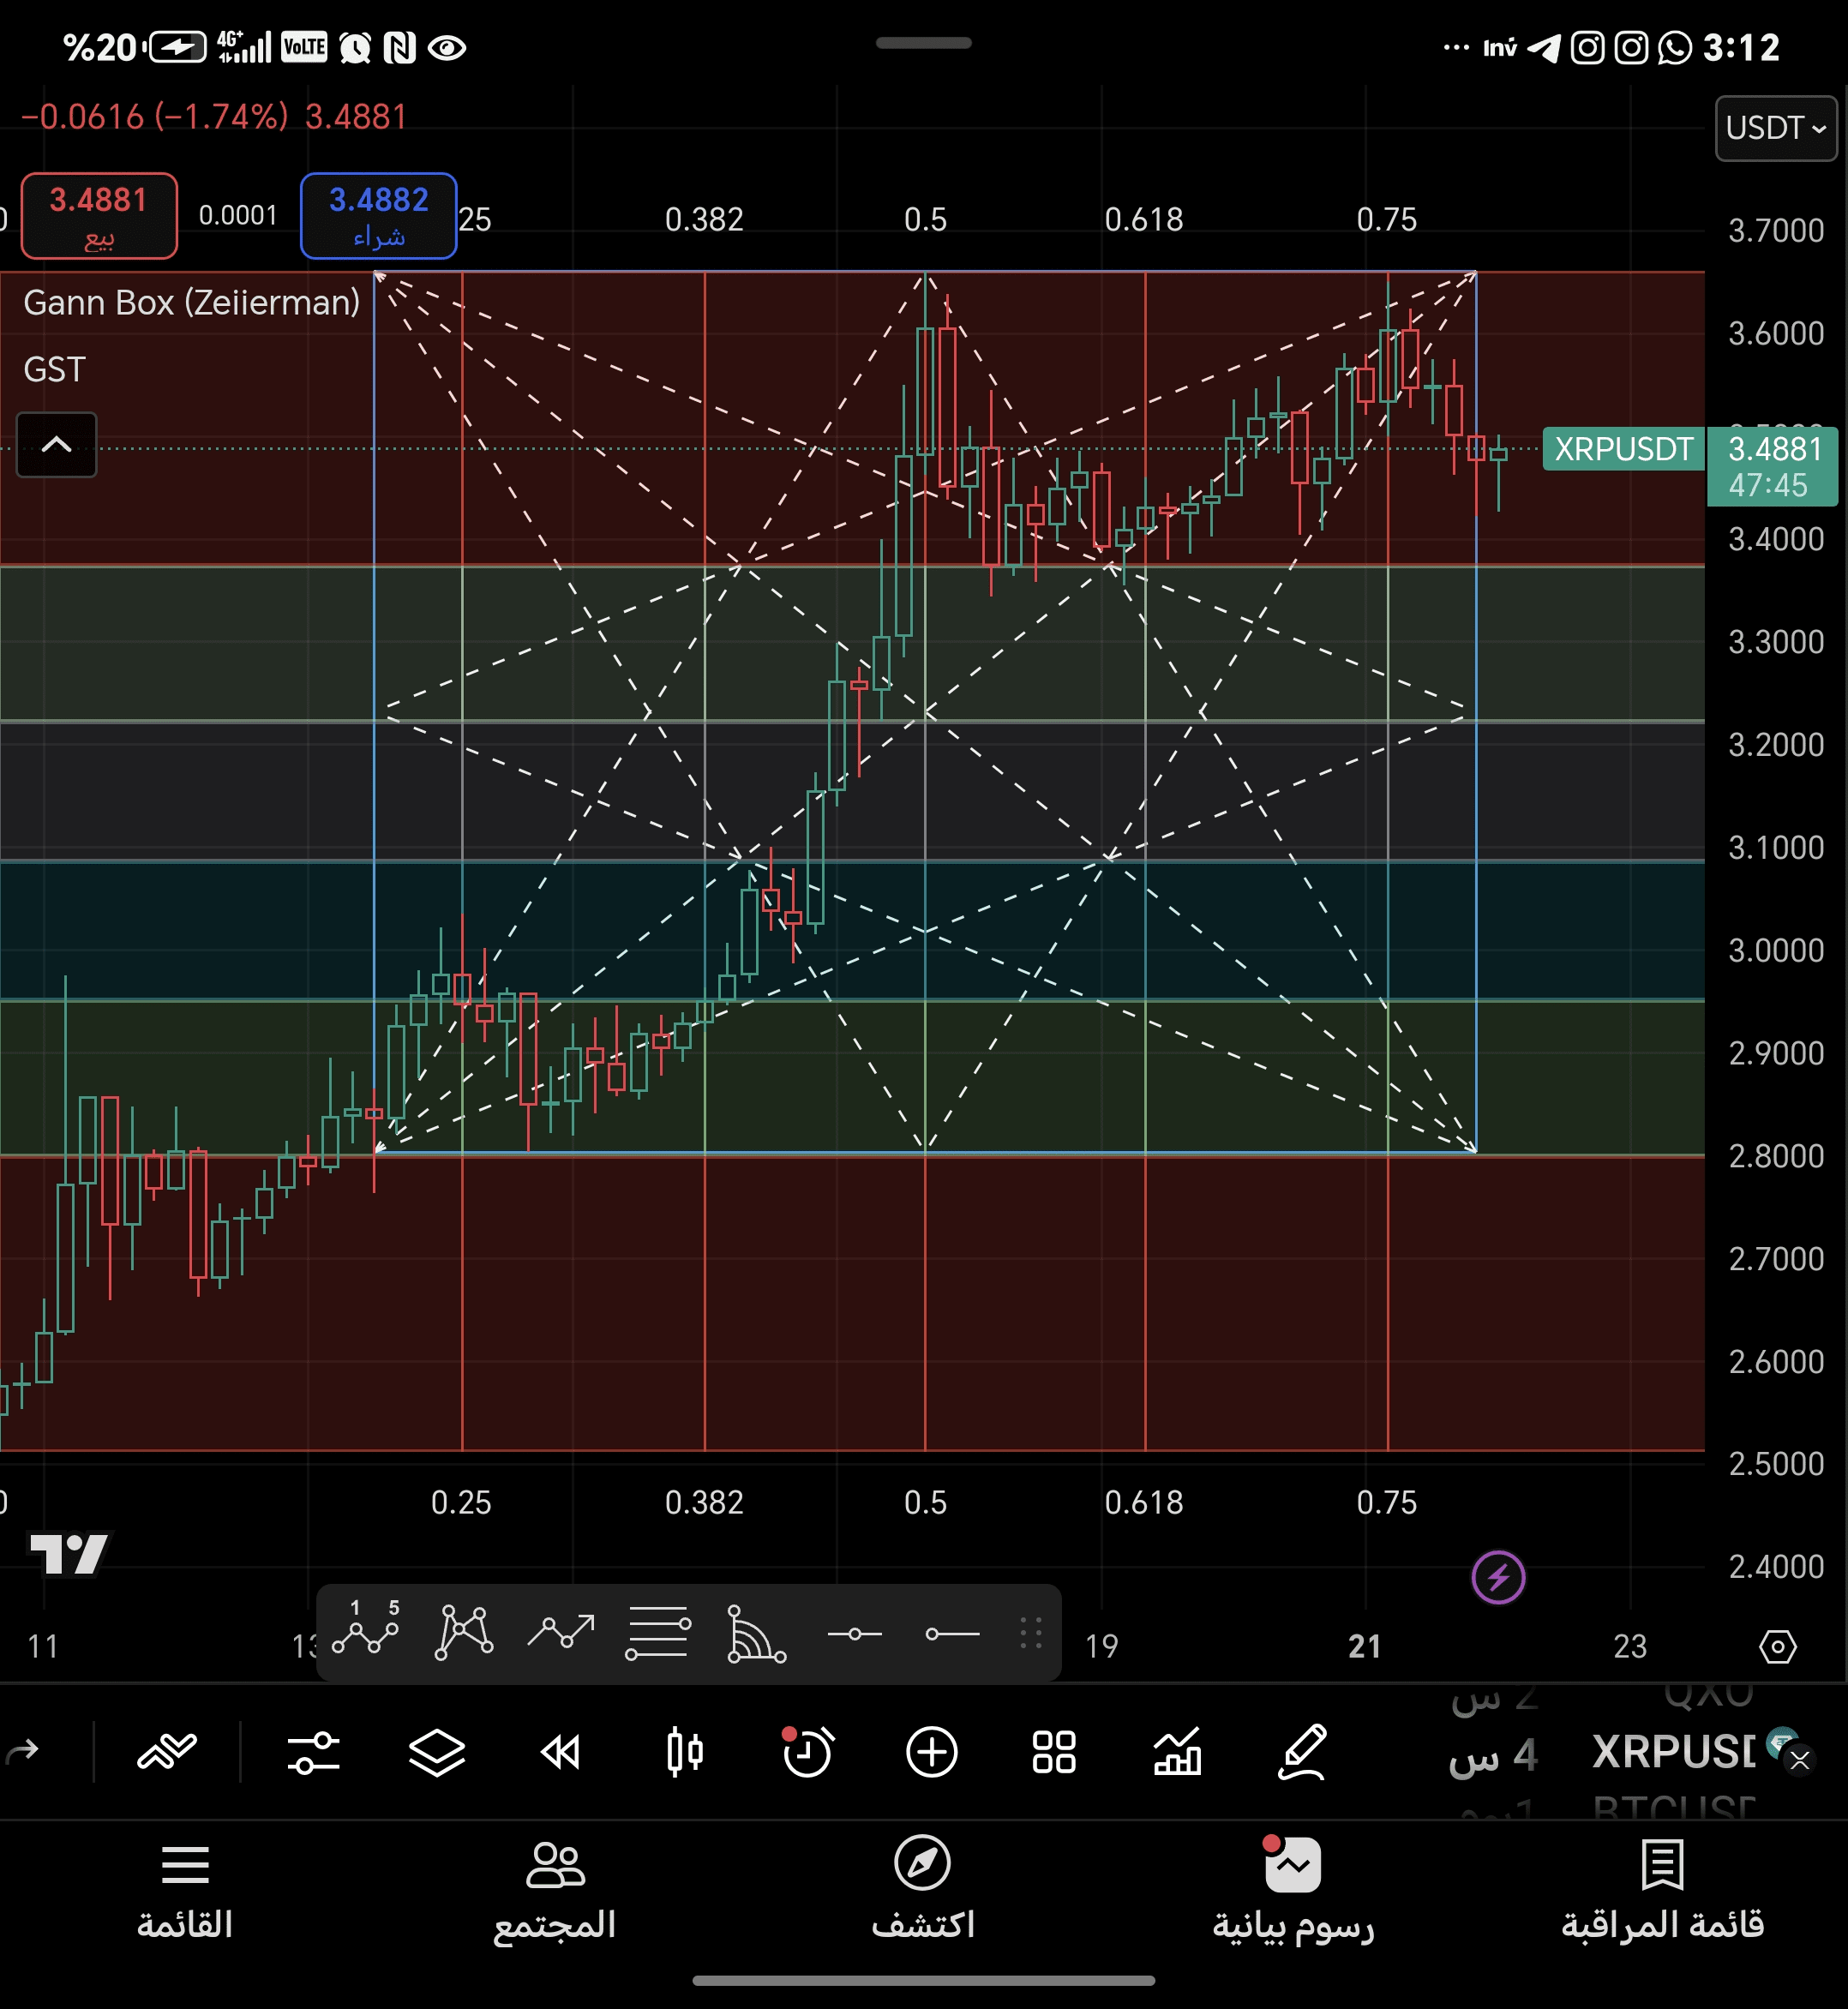
🔹 Current Price: 3.4881 USDT
🔹 General Trend: Upward but facing strong resistance
📐 Gann Box Tool:
The Gann Box is drawn between the low of 2.80 and the peak of approximately 3.65.
The price has moved harmoniously within the time and price angle lines, giving credibility to the analysis.
🔼 Key Resistance Zones:
3.60 – 3.65: Previous peak and strong resistance at the 0.75 Fibonacci level.
3.70: If broken, the next target may reach 3.85 – 4.00.
🔽 Strong Support Zones:
3.40 – 3.42: Important current support at the 0.618 line, and the price tested and bounced off it.
3.20: Medium support level and previous low.
2.90 – 3.00: Strong medium-term support at the 0.382 level.
🔁 Price Action Overview:
Strong accumulation between the levels of 3.30 and 3.60.
Selling pressure candles appeared after approaching the peak of 3.65.
No strong reversal signal yet, but the trend is slowing down.
📊 Expected Scenarios:
🟢 Positive Scenario (Bullish Breakout):
If the price holds above 3.50 and closes with a strong candle, we might see a push towards 3.65 then 3.85.
🔴 Negative Scenario (Bearish Correction):
Breaking 3.42 may bring the price back to 3.20 or even 2.95.
Breaking these levels means exiting the upward channel.
📉 Additional Indicators (prefer confirmation from the chart):
RSI: If above 70, indicates overbought conditions (correction signal).
MACD: Potential negative crossover.
Volume: Decrease in buying momentum.
🧭 Summary:
The general trend is upward, but it faces strong resistance.
Safe entry is after breaking 3.60 consistently.
Proposed stop loss: Below 3.20.
Best support for traders: 3.20 – 3.30.
Best targets for investors: 3.85 – 4.00 – 4.25.