I have been trading cryptocurrencies for over ten years, from liquidation to achieving financial freedom, supporting my family through crypto trading. By 2024, my funds multiplied by 50 times. If it weren't for twice withdrawing funds to buy a house in between, it should have been 85 times.
Today, I will share my trading strategies and insights with my friends in the crypto community.
There is a saying that goes, standing on the shoulders of giants can save you ten years of struggle.
At the end of the article, I will also share the most important skills and methods.
For those who are fortunate to see this and want to improve their level in the crypto space, be sure to read carefully and consider saving it!
Survival rules:
Use 2% of the position for trial and error (maximum loss of 2000 for each 100,000).
Set up automatic take profit and stop loss (do not trust your own hands).
Establish a trading log (recording the emotions behind each operation)
Weekly review (analyzing which operations were influenced by emotions)
Path of evolution:
▫️ Beginner: Crying from being abused by the market (90% fall here)
▫️ Intermediate: Learning to trade with discipline (6% can achieve this).
▫️ Advanced: Unfazed by fluctuations (Ultimate player at 0.9%)
▫️ God level: Harvesting emotions (Top of the food chain at 0.1%)
The market will not punish you, but it will definitely teach you.
Some say that the market is the fairest teacher. It will not punish you for making mistakes, but it will repeatedly give you the same lesson until you truly learn.
There are no "secrets" in trading, and there are no "shortcuts" in the market.
Do not be thrown off by temporary gains and losses; the crypto market is both a game against the market and a game against yourself.
The fluctuations in K-lines in the crypto market are not only the trajectory brought by investment capital but also a record of changes in investor sentiment. The fear of missing out leads people to buy at highs, while fear leads them to cut losses at lows. Those who survive and thrive in the crypto market are often those who can control their emotions and persist.
These investors have clear trading strategies and strict entry and exit standards, which is what many people refer to as an investment system, rather than being swayed by short-term market fluctuations, which may lead to a lucky win once, but will definitely not allow one to survive long-term in the crypto space.
Sunny teaches you to draw precise trend lines, refuse to be a novice!
1. Downward trend line
I believe many friends know about trend lines. What is their main function? Today I will explain it to everyone. Trend lines are mainly used to judge mid to long-term trends, and their basic points are to mark support and resistance levels.
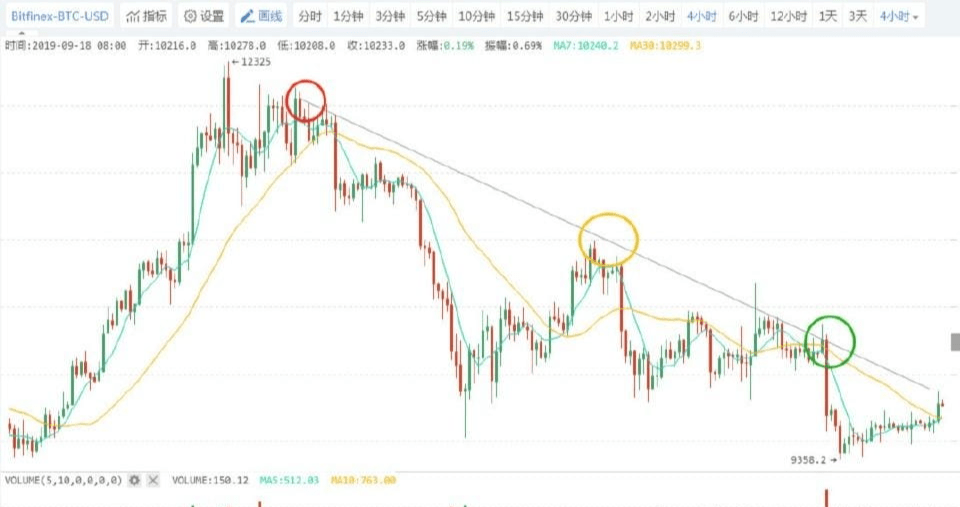
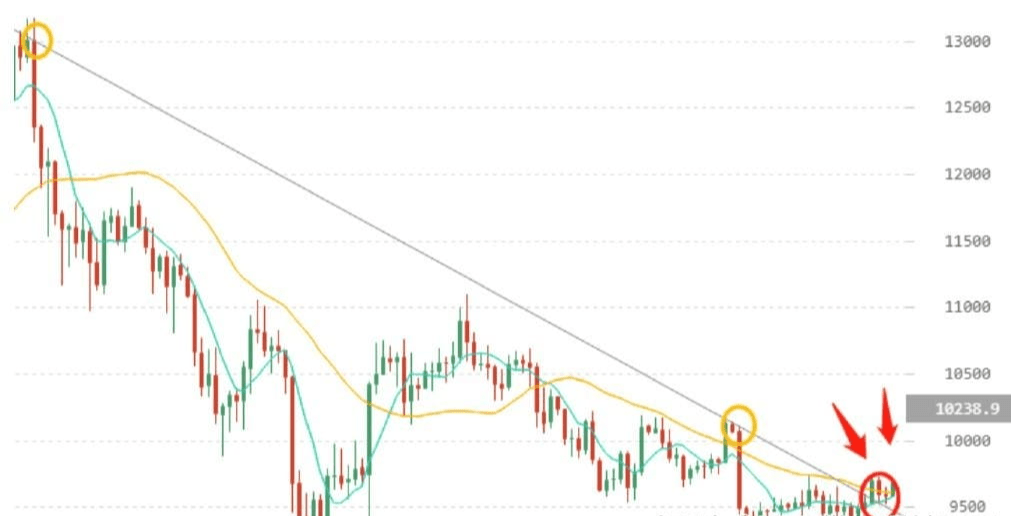
Take a look at this chart: This is the 4-hour chart of BTC, where the straight line represents the downward trend line. Each time the price approaches the red circle, it tends to fall back, so this downward trend line is currently a resistance level for the price.
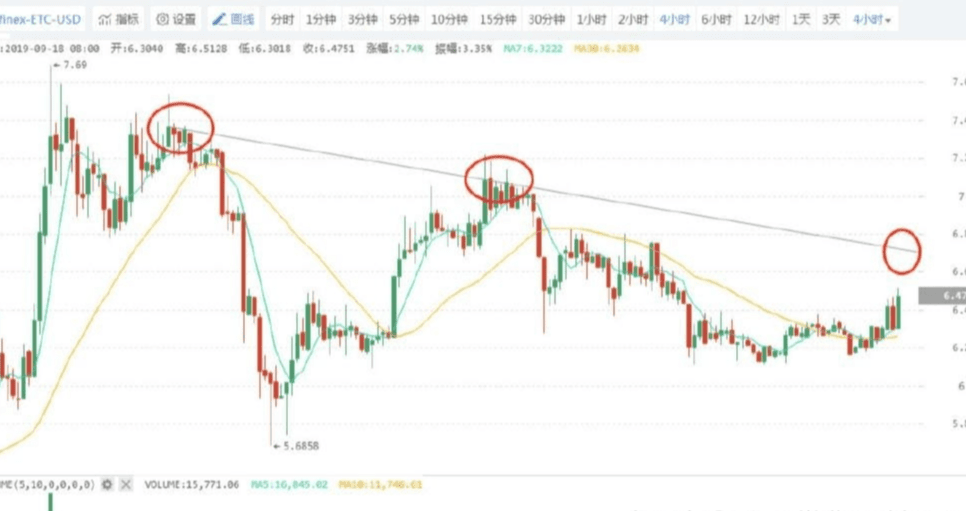
From the above chart, we can see that the current price is not far from the straight line. If the 4-hour price approaches the straight line, there is no need to ask; it must be a short position, because this line is a downward trend line. The downward trend line is used to judge the downward market.
2. Upward trend line
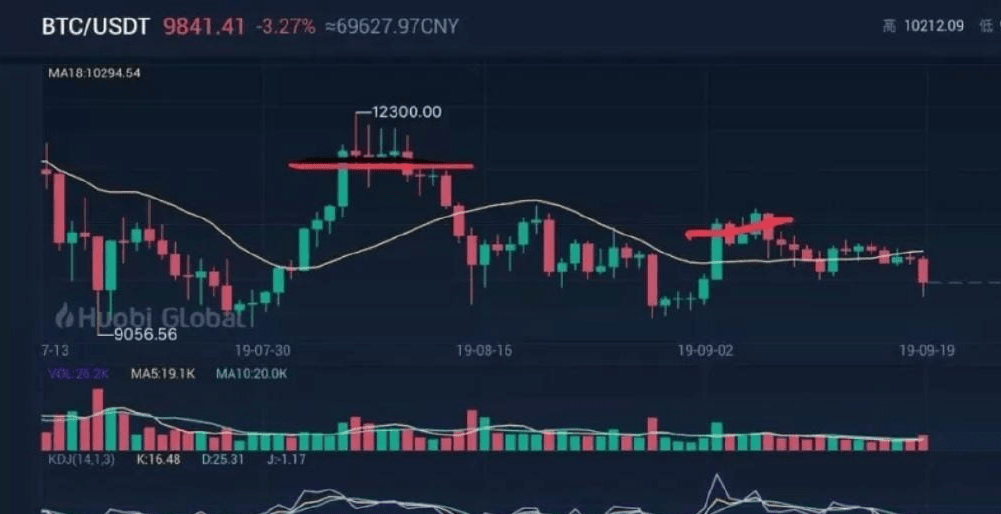
Look at the chart below: This is the 4-hour chart of HT. From the chart, we can see that every time the price retraces, the low point is just above the blue line. After touching the blue line, it should rise. Therefore, the upward trend line on the blue line is an important support level for the price.
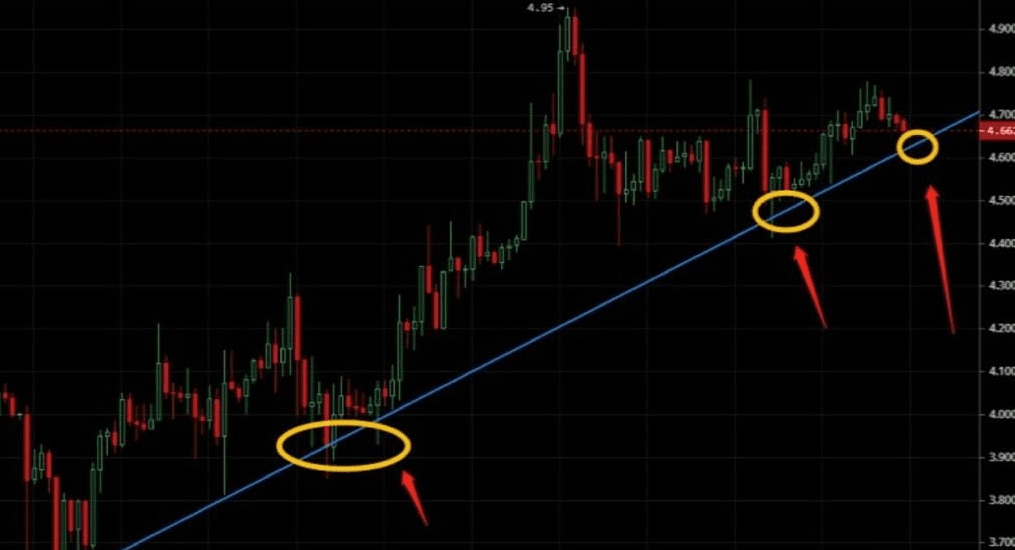
So, if the price falls back to the upward trend line, will it be supported? Once it holds, we can consider entering the market for long positions, aligning with the upward trend.
3. How to draw lines
After explaining the upward and downward trend lines, everyone will be curious about how to draw these trend lines.
Two points connected form a line. This is the simplest way to draw a line! However, the drawback of this method is obvious; it lacks reference significance.
To draw a high-quality trend line, a good method is to find three clearly formed points. These three points should be the high or low points of price fluctuations and can connect to form a clear line. For example, in the 4-hour chart of BTC shown below, we draw a line through the two points.
Next, we want to verify whether this downward trend line is useful and valuable! We need to find a third point to validate it.
Extending the trend line, we can see the third point: the green circle is also on this trend line. Thus, we can conclude that this blue downward trend line is effective and valuable for the current market situation!
The more points on the trend line, the more significant that line is! Fewer points mean less significance!
The trend lines drawn on a large cycle have a greater significance than those drawn on a small cycle! This is due to the effect of the cycle! For example, a trend line on a 4-hour chart has more significance than a trend line on a 15-minute chart.
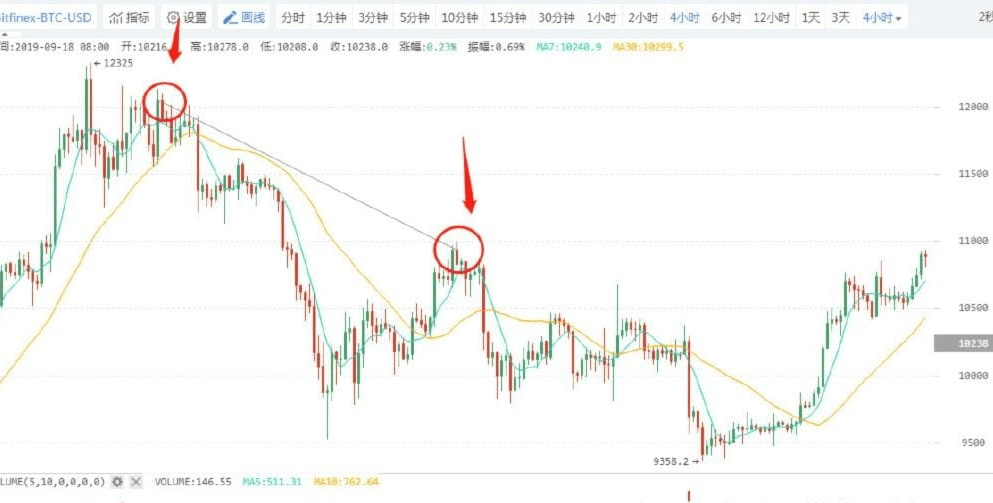
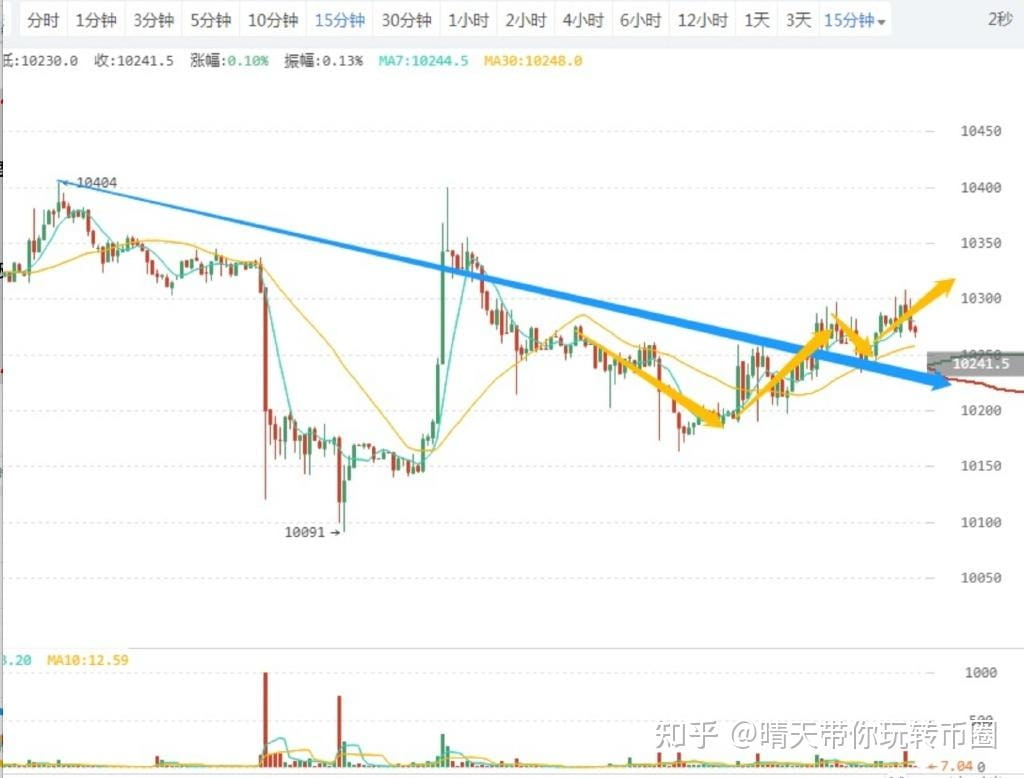
Comparing the 15-minute BTC trend in the image below, the downward trend line was broken by the price. The short-term trend, as shown in the image, resulted in an upward wave. What is the reason for this?
The reason is that the 4-hour trend line has not been broken, so the 15-minute and 4-hour charts should be viewed together. The impact of longer cycles is greater; short-term trend charts are mainly used for short-term trading or contracts.
4. Tools for capturing trend line breakthroughs
When a trend line is broken, it means there is strong support or strong resistance. Therefore, if this market structure is broken, important breakthroughs may occur. To capture the breakthrough of the trend line, I often use the closing price determination method, which is to look at whether the closing price also breaks through the trend line!
Because the price often pierces through the trend line, but if the closing price still adheres to the trend line, this is a common false breakout. Many friends may fall into this trap.
We can analyze this together. In the image below, lines 1 and 2 are drawn well and have significance. But one thing to note is that if these two lines no longer have significance for the current market, they should be removed, otherwise, they may cause misunderstanding.
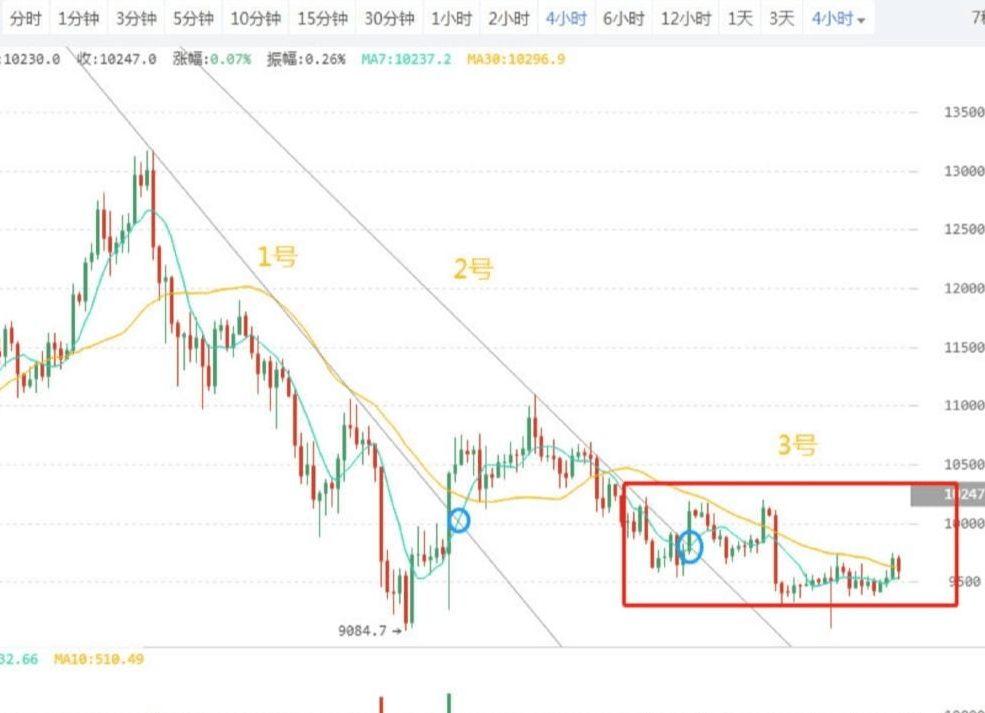
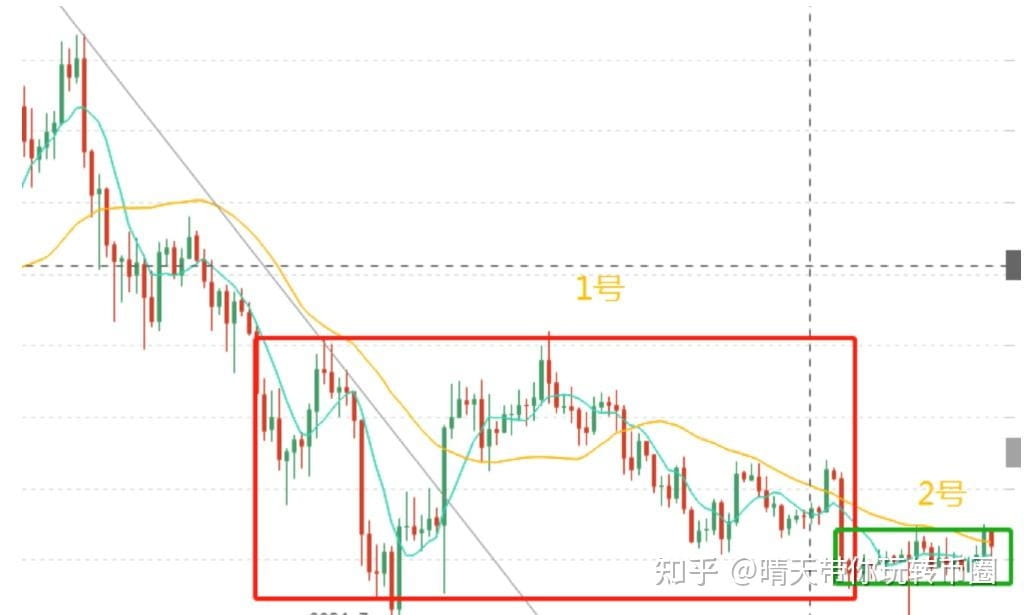
In the 3rd oscillation range, the drawing is not perfect. You can look at the chart below, where I have divided it into two oscillation ranges.
Everyone can determine trend breakthroughs using the closing price determination method! In the 4-hour BTC market, after the K-line closes at midnight, everyone can see if this line has been broken.
In fact, personal line drawing is developed through countless practices on the chart. Practice makes perfect. This is also a key point in drawing lines! Only when you are skilled can you draw accurately and effectively, allowing yourself to make money from trading.
5. Interactive Q&A
1. Question: Today's sharp decline, I think is already the short-term bottom, what do you think, Feitian?
Answer: I think it should be said that a big market movement will come around November. These days, let's see if it stabilizes. If it does, we can start building positions now, which is relatively appropriate. Because mainstream coins have been going up for several days in a row and then pulled back, we can open some short positions for hedging. Those who hold can open short positions for hedging, and those who don’t can start building some positions now, or wait for it to drop a bit more before adding. It's essential to maintain necessary positions in your mainstream coins; otherwise, if there is a sudden surge of 10 or 20 points in a day, you won't be on board and will feel anxious.
2. Question: When will GXC rise?
Answer: For GXC, it is recommended to maintain a low position or reduce your position. It has recently attracted a lot of attention, so focus on whether the operational team is still active.
3. Question: Generally, should you open a position or reduce your position immediately after breaking the trend, or wait for a while to see if it stabilizes?
Answer: Generally speaking, if you have positions, it is easier to operate. For example, if you establish a three-layer position, if it rises, you can add to your position upon seeing an upward trend; if it falls, you can keep a certain position and add to it when it drops by 10 or 20 points, lowering your holding cost.
4. Question: Can the teacher only connect the pressure line to the highest points of the K-line? Can't it connect to the closing price? How are the high and low points determined?
Answer: The highest point is just a form. The most important thing is to mark the high and low points within a certain range. The highest price with volume, whether it's a bearish or bullish candle, is the high point. The same applies to the low point.
I've found that many people say short-term trading is speculation.
First of all, Sunny wants to say that short-term trading is not speculation. Real short-term trading is an investment behavior that requires a mastery of certain market operation rules and strong skills. Short-term trading actually tests a person's skills and patience.
1. Formulate a clear investment plan. If you want to do short-term trading, first create a clear investment plan for yourself, including how much capital to use and what monthly returns to expect. All of this needs to be planned according to your risk tolerance.
2. Ensure you have enough time and energy. Day trading focuses on the number of profitable trades rather than large single profits. Develop your own trading principles and habits; don't trade just for the sake of trading, and don't feel anxious when you're not trading.
3. Because short-term investments generally involve frequent trading, it is very important to choose what kind of cryptocurrency to invest in, and trading must be continuous.
4. When holding a profitable position, close it once you reach your psychological price point; do not aim to take the entire profit. Also, pay attention to position size and leverage control, and learn to strictly manage your positions according to the leverage of the products you are trading combined with your own capital.
5. Use technical indicators: There are countless technical indicators in the market, at least over a thousand, each with its own focus. Investors cannot cover everything; just familiarize yourself with a few commonly used indicators like KDJ, RSI, etc.
6. Use moving averages: Short-term trading generally refers to the 5-day, 10-day, and 20-day moving averages. When the 5-day moving average crosses above the 10-day and 20-day moving averages, and the 10-day moving average crosses above the 20-day moving average, it is called a golden cross, indicating a buying opportunity. Conversely, it is called a death cross, indicating a selling opportunity.
7. During rapid fluctuations, try not to operate.
8. Do not look too much at others' analyses; everyone says different things. The price trend is influenced by many factors, and all predictions about the future are uncertain; half right and half wrong. Just believe in yourself.
The opportunity has come, assets double! Follow Biao Ge closely and easily earn big money.
Continue to pay attention to: DIA, CFX
