
Here is the thing, the young charts we are using for the short-term trades, and this makes sense because we can't make much of a long-term prediction with no data ok?
Let's trade!
Basic and simple. I can't do it any other way so you will see me repeating the same. The truth is that simple works. If you can't explain something in a simple manner, it simple means you don't understand it well enough. Well, I understand this thing nicely because I will make it so simple for you, that you have to agree and even a three year old can say, "True, Master is right, I agree with his interpretation of the chart."
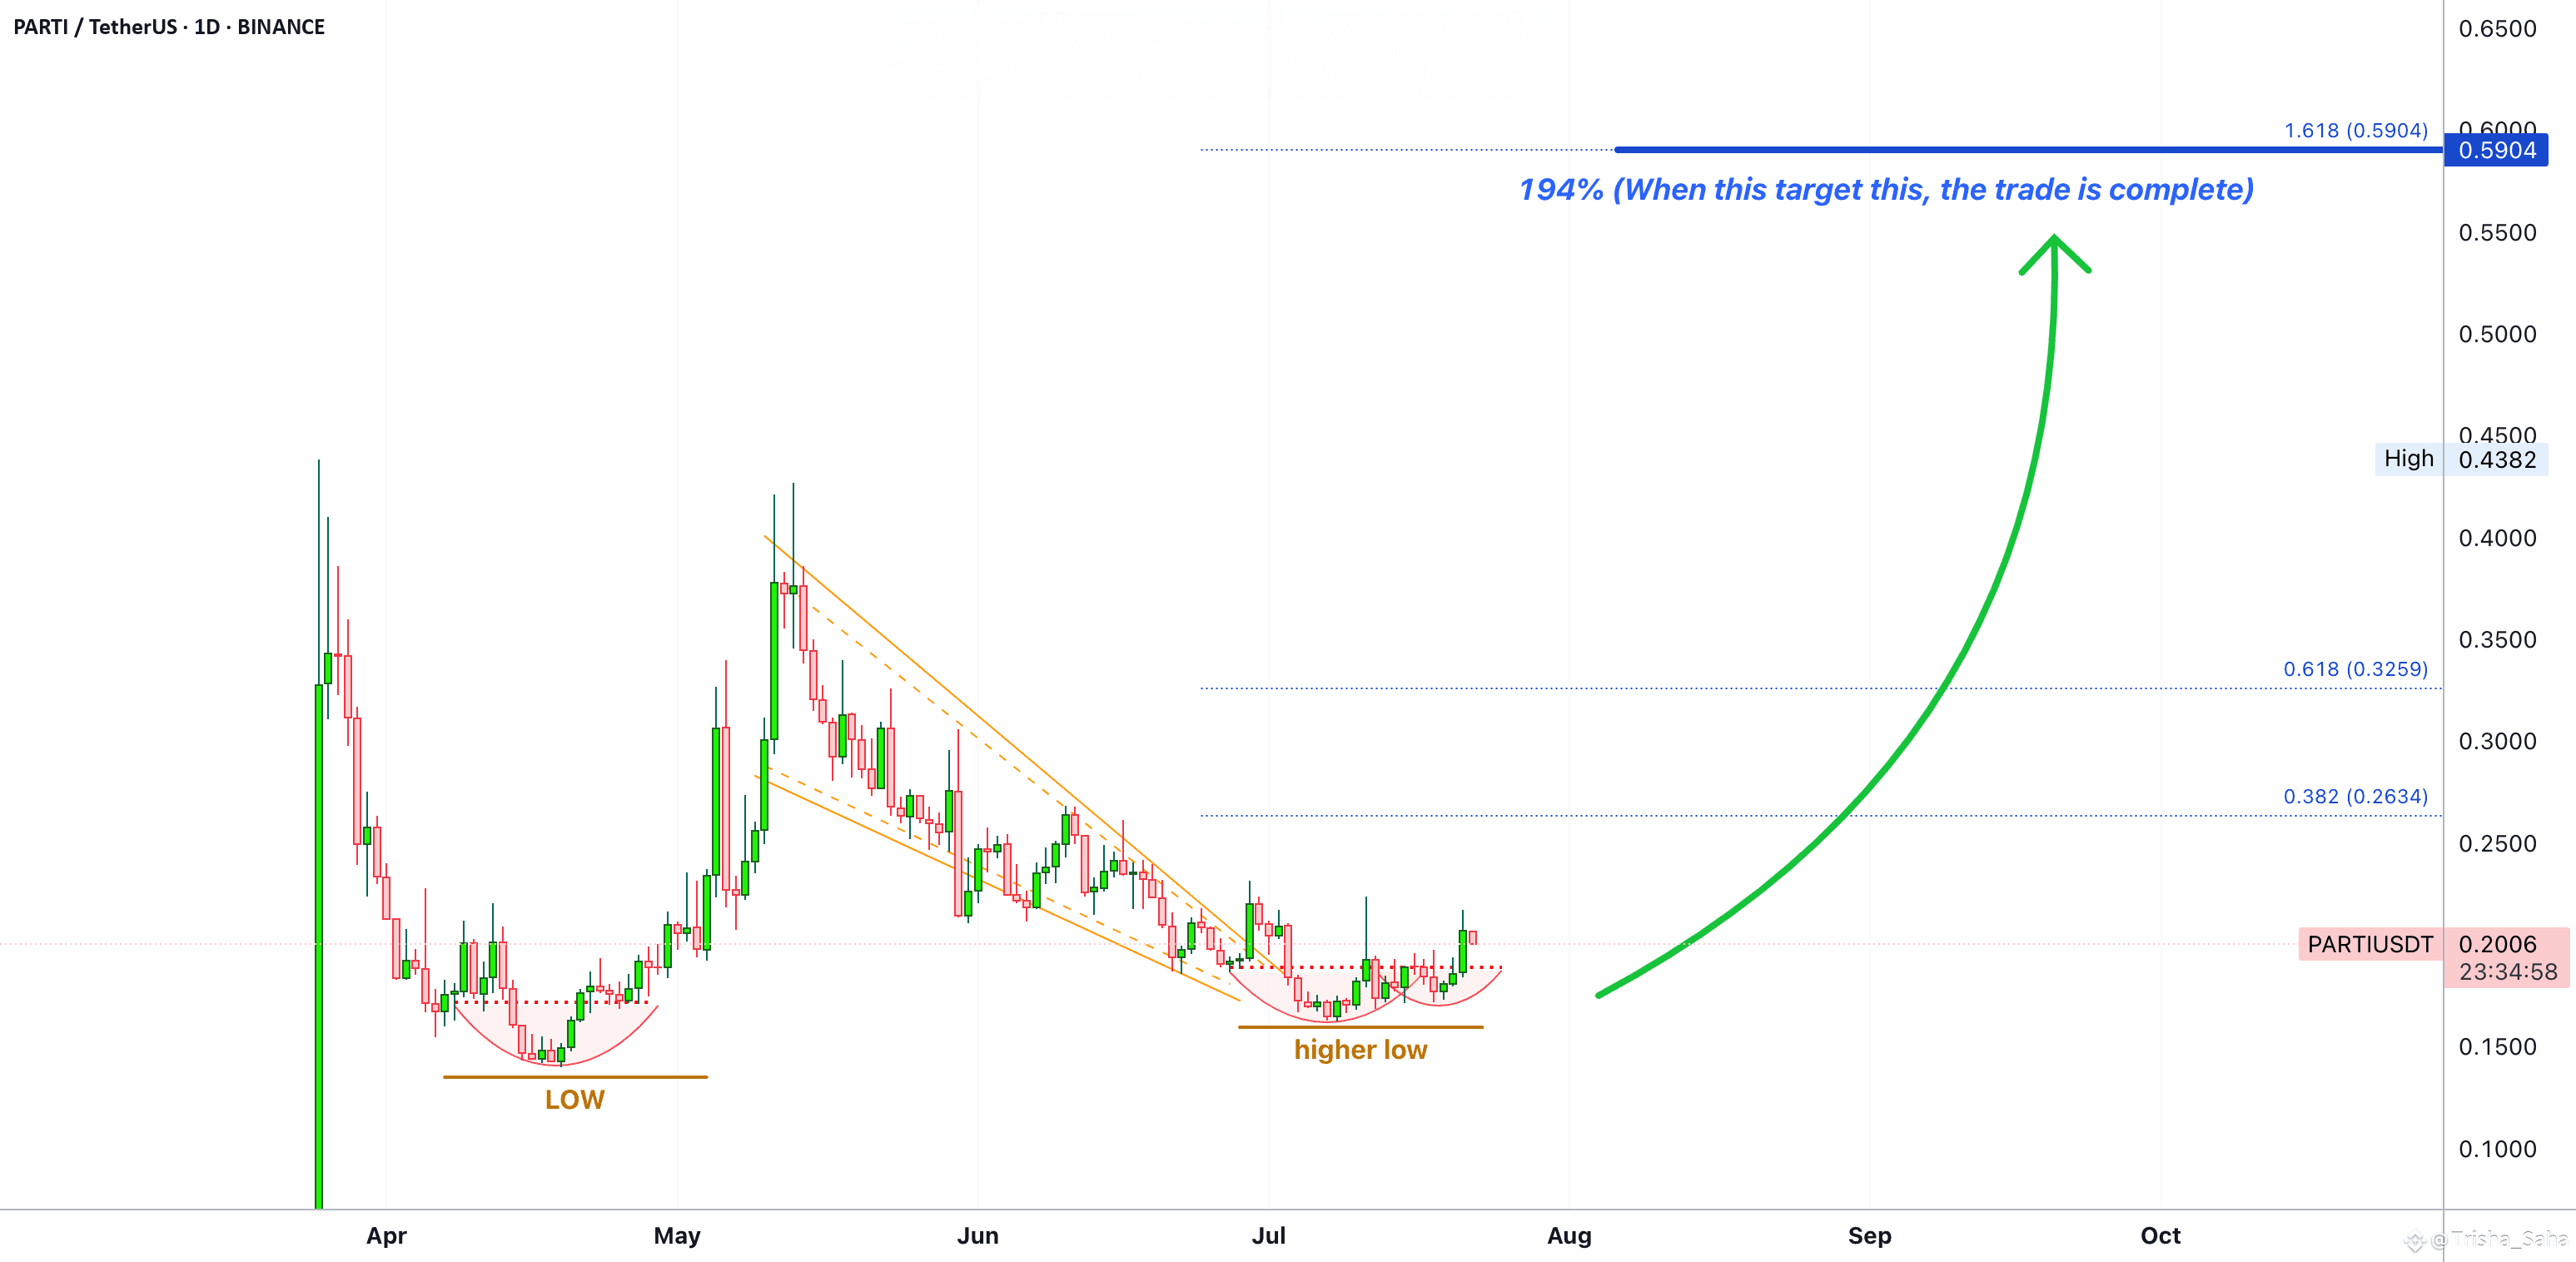
Low and higher low. Beautiful.
A bullish wave leads to a correction. The correction ends in a higher low. This confirms the bullish bias. The higher low is the place that will launch the next leg up. Minimum target is always the 1.618 Fib. extension. This is mapped on the chart as 194%, once it hits, the trade is closed and over. Take the profits and move on.
Thanks a lot for your continued support.
Thank you for reading.
Namaste.
#TrumpBitcoinEmpire #BTCvsETH #ETHBreaks3700 #StablecoinLaw #NFTMarketWatch