1. Market Review
Last week's article (accurately predicting the Bull Demon King will appear in wave 3-5 on July 13-14! Fish and shrimp should be cautious on July 11 or 14, as it approaches the ultimate peak!) mentioned that the Bull Demon King ended wave 3-5 on July 14, which indeed was the case.
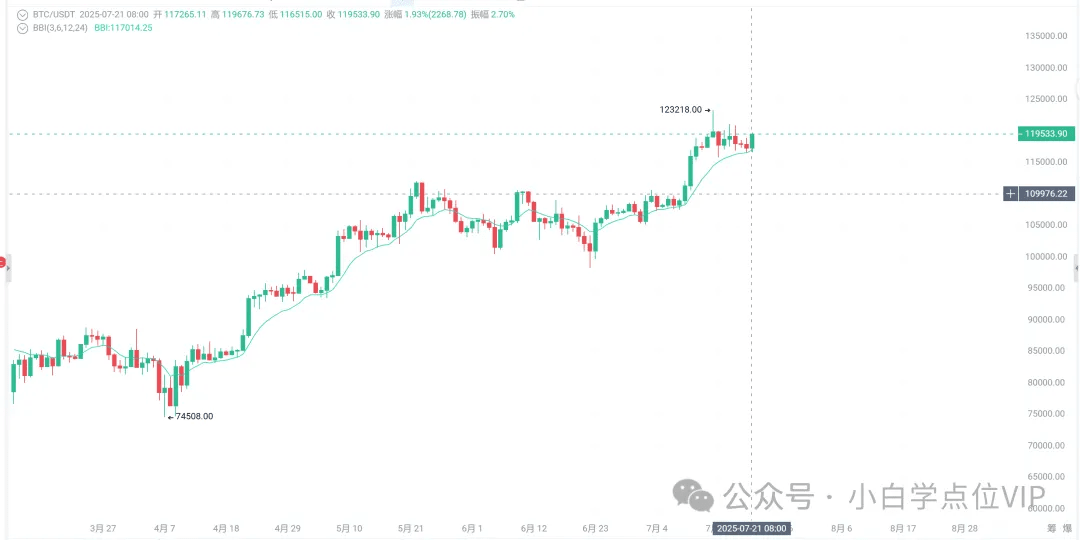
In the analysis of the Bull Demon King, it was very precise: [if it does not pierce 119488, there is still 1 small wave above 122666 to end wave 3-5, with upward targets of 123138.37-123596.03-125270.03, and extreme 125637.6. If it pierces 119488, then wave 3-5 has already ended], ultimately reaching 123218, fitting the 123138 target!
The Bull Demon King, in the private circle on July 15, let us focus on connecting at the resistance of 115860.5, which then began to rise. Auntie was 32 beautiful knives away from 2900.16.
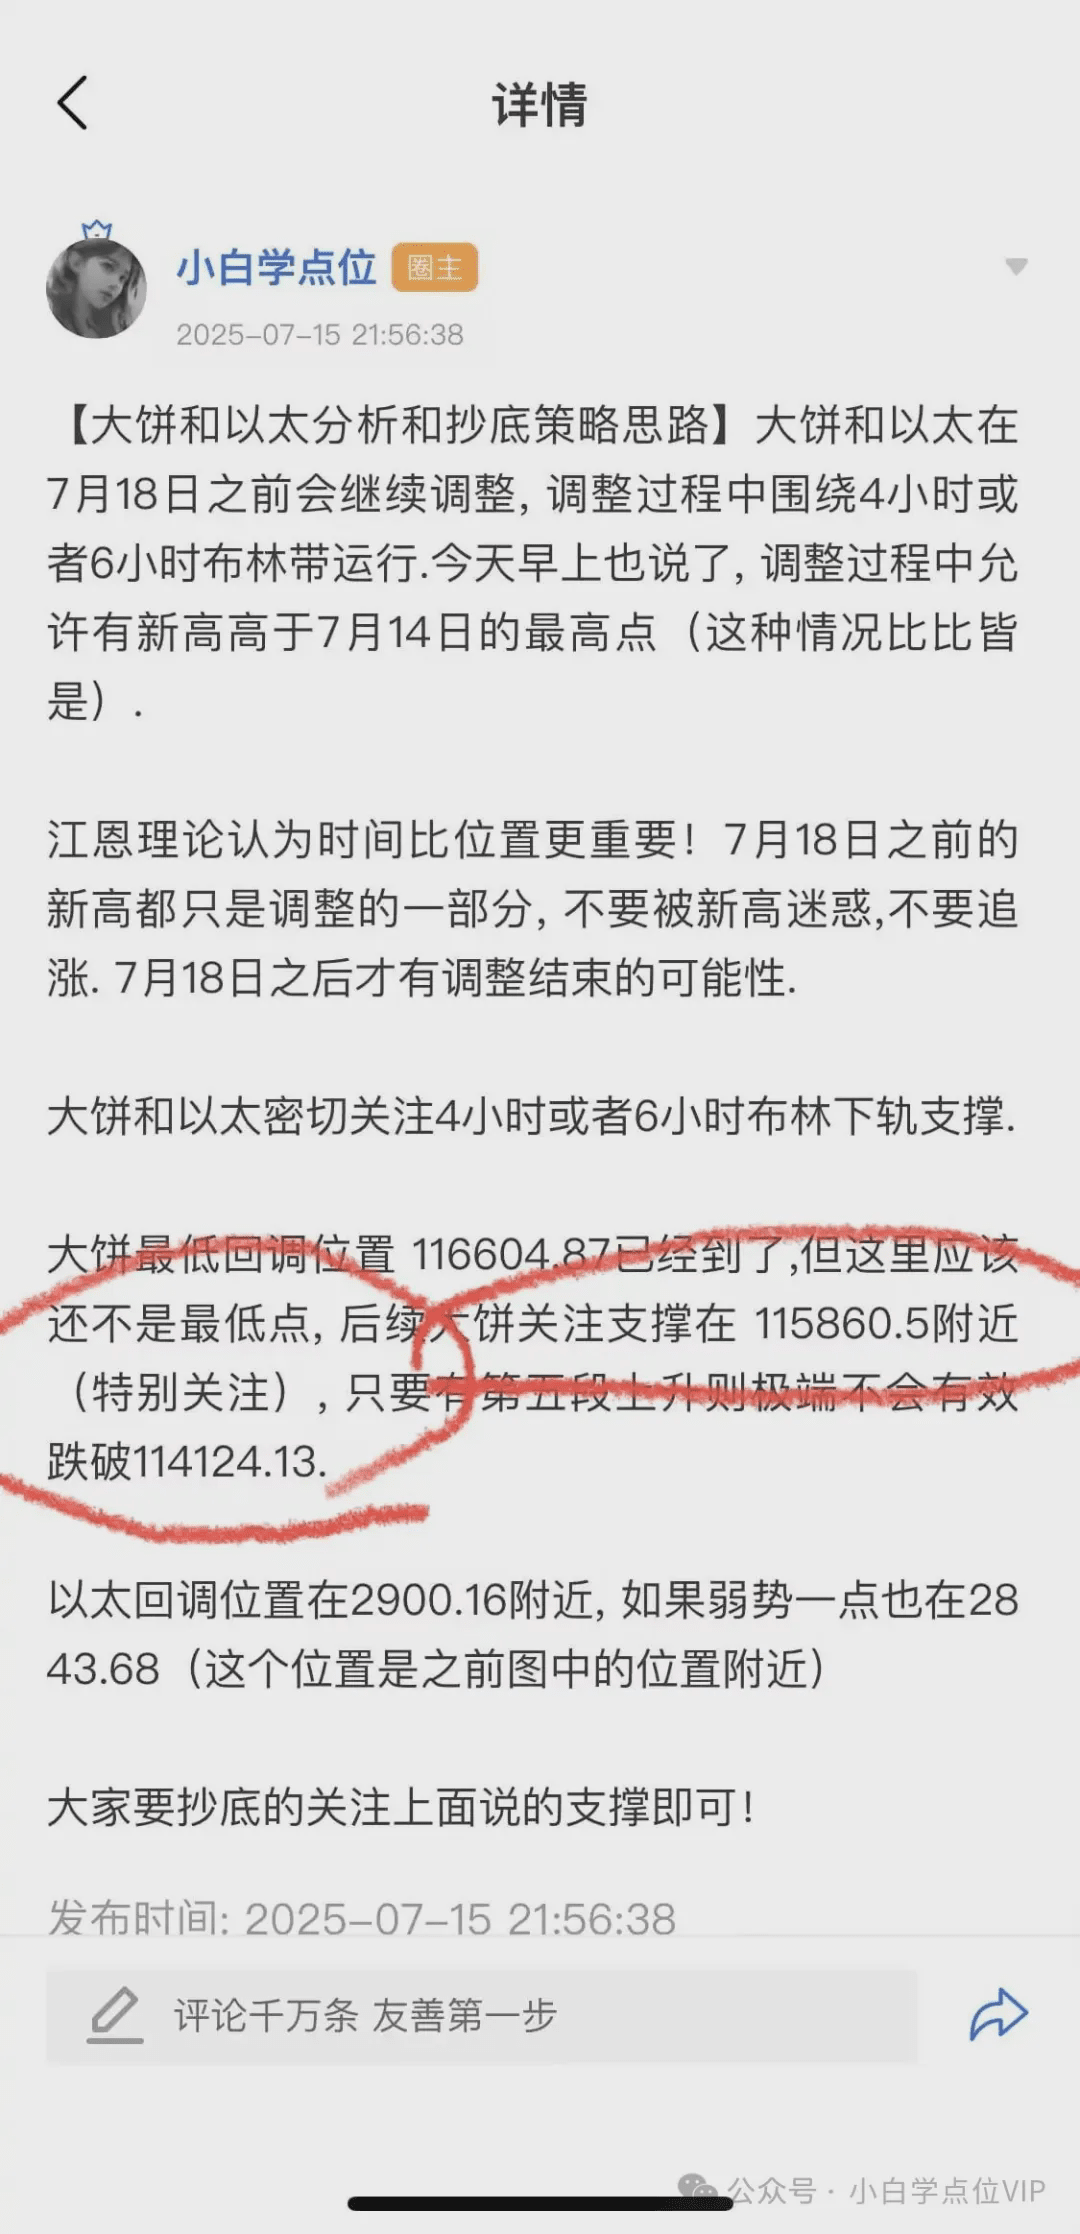
Today, the Bull Demon King also reached near 116375 as mentioned in the chart:
In the analysis of Auntie, the miscounting of waves led to an underestimation of Auntie's rising potential! The private circle also repeatedly corrected this, pointing out that [the starting point of Auntie's wave 3 is at 2372 on July 2, and the counting method follows the 'counting method two: the third segment evolves into a larger level of rising' proposed in the private circle on July 10]. However, Auntie has repeatedly exceeded expectations: [from wave 5 at 3600, then to 3900-4000, and then to the monthly Bollinger upper track or above].
In analyzing fish and shrimp, due to Auntie and the Bull Demon King's different trends, and Auntie's repeated exceeding expectations, the expectation of [fish and shrimp reaching the peak ahead of July 13-14] is not valid. Many fish and shrimp have early exceeded the high point of July 13-14, which indeed was a slap in the face.
Therefore, I have also published several articles at a certain An Square (before the rise of wave 5, which fish and shrimp should catch the last bus for the best cost performance?) correcting:
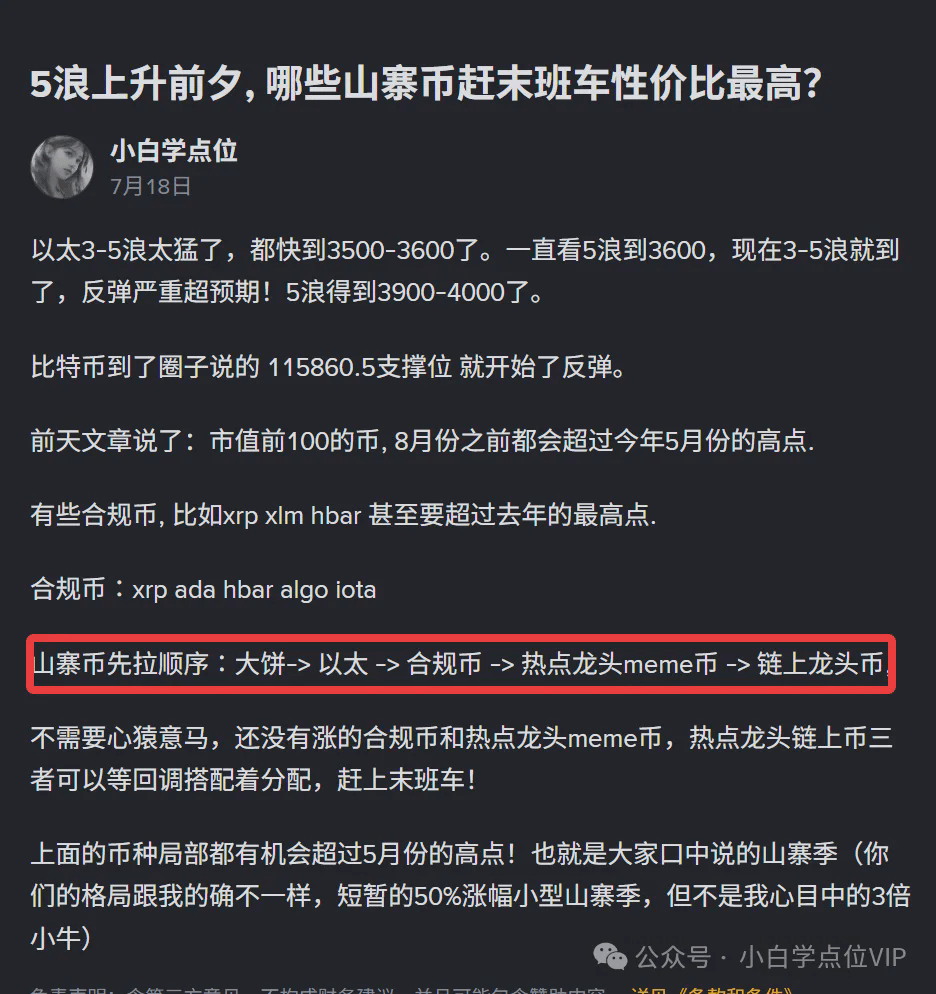
(Is the season for fish, shrimp, and crabs coming as you say?), (Auntie has risen significantly by 3600+, how much longer can it last? You can't imagine Auntie's two long-term scripts! Bull Demon King, XRP, and SOL analysis! The season for the fish, shrimp, and crabs you mentioned has arrived!), the article also proposed [Auntie's two long-term scripts], which will be detailed in subsequent chapters:


2. How we caught the last bus of the altcoin season?

I have always emphasized that time is more important than position. My analysis may differ in position, but I am very precise on the turning time nodes!
Last week's article (accurately predicting the Bull Demon King will appear in wave 3-5 on July 13-14! Fish and shrimp should be cautious on July 11 or 14 as it approaches the ultimate peak!) mentioned [if you think this is the season for fish and shrimp, connect on July 18 to July 20 at the next bottom], the last connection time node for fish and shrimp indeed was on July 19, meeting the expectations from July 18 to July 20!
On July 18, the private circle also issued a forecast, reminding everyone to make a big push and wait for a turnaround after a week:

On July 19, many fish and shrimp were connected after the significant decline! On the afternoon of July 20, before the major rise of fish and shrimp, two reminders were given to increase the position again!


(1) Last year's 1000% fish and shrimp rose significantly by more than 30%!
On July 18, the private circle reminded [if you don't understand which fish, shrimp, and crabs to get involved with during the fish and shrimp season and fear getting stuck, you can get involved with this fish and shrimp, which is currently at the historical lowest point, and it's basically impossible to get stuck! The upward space is greater than the downward space. This fish and shrimp increased 1000% last year!], on the evening of July 18, this fish and shrimp had already risen by 30%! We got involved before the launch!

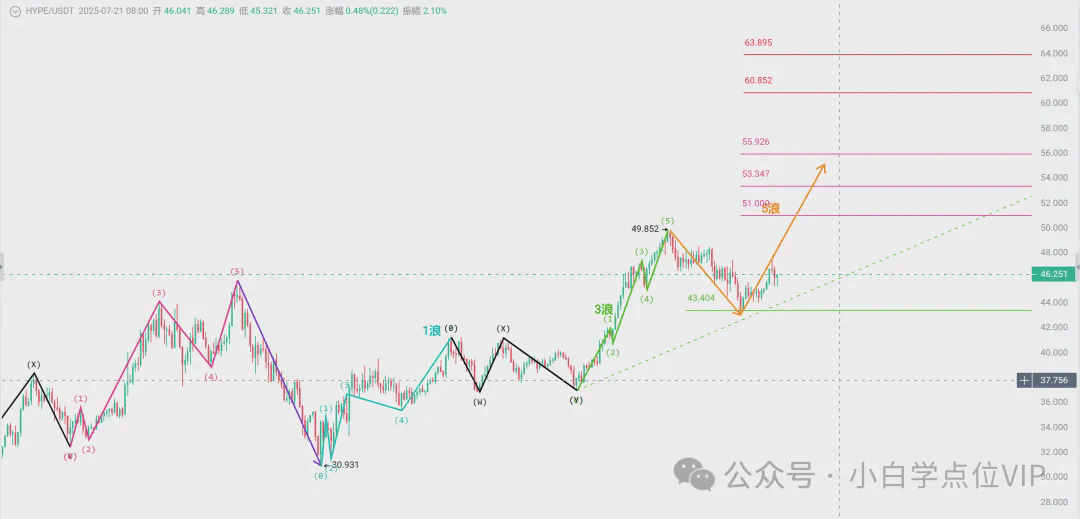
(2) Hype is exactly the same as in last week's article (accurately predicting the Bull Demon King will appear in wave 3-5 on July 13-14! Fish and shrimp should be cautious on July 11 or 14 as it approaches the ultimate peak!) The yellow line in the chart reached the bottom and then rose!
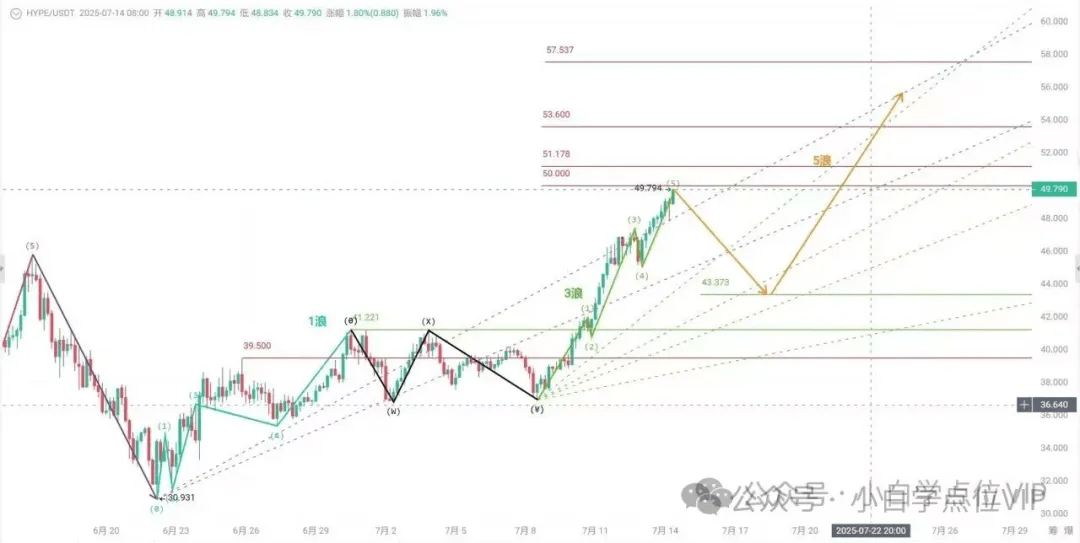
The latest chart is as follows:
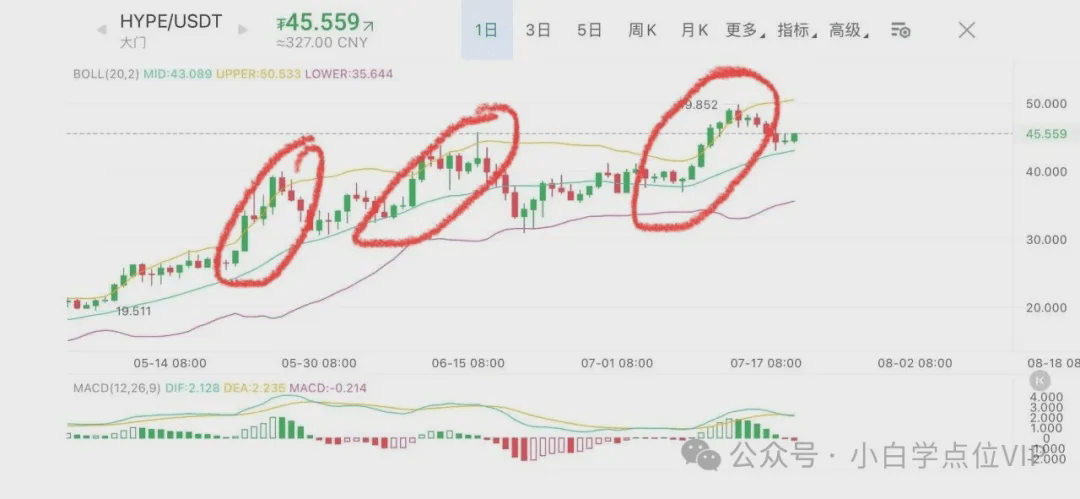
Why do I emphasize getting involved with this hype? The private circle has provided an explanation:


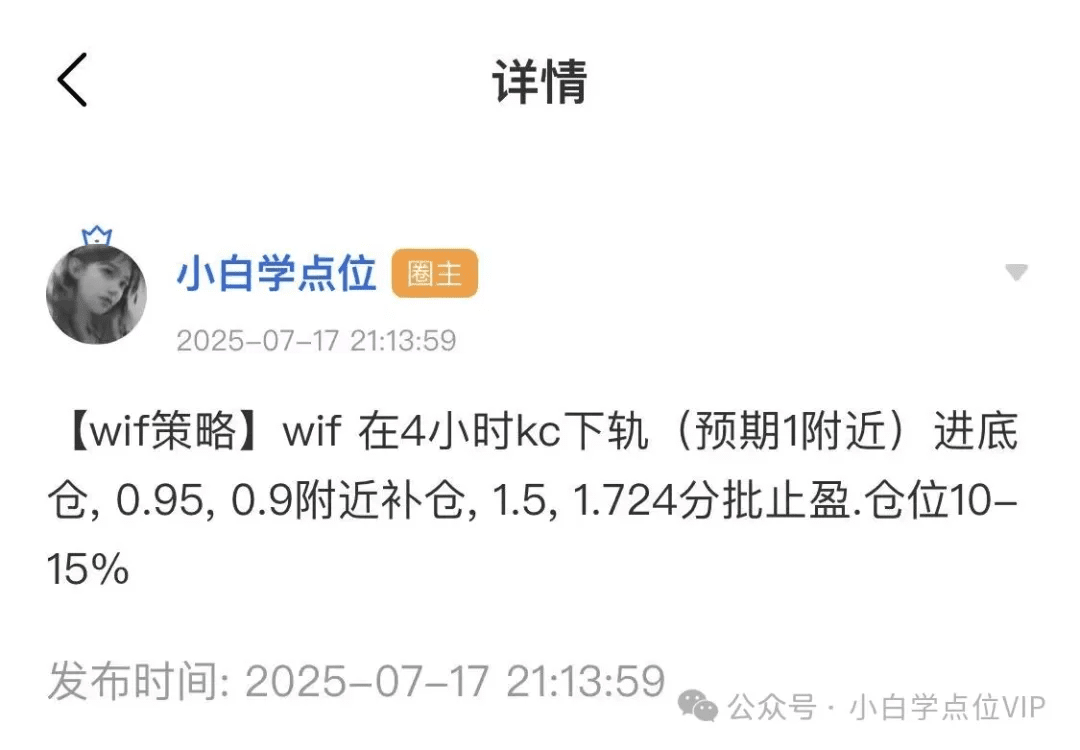
(3) In 1 connected WIF, it rose sharply by more than 30% in two days!
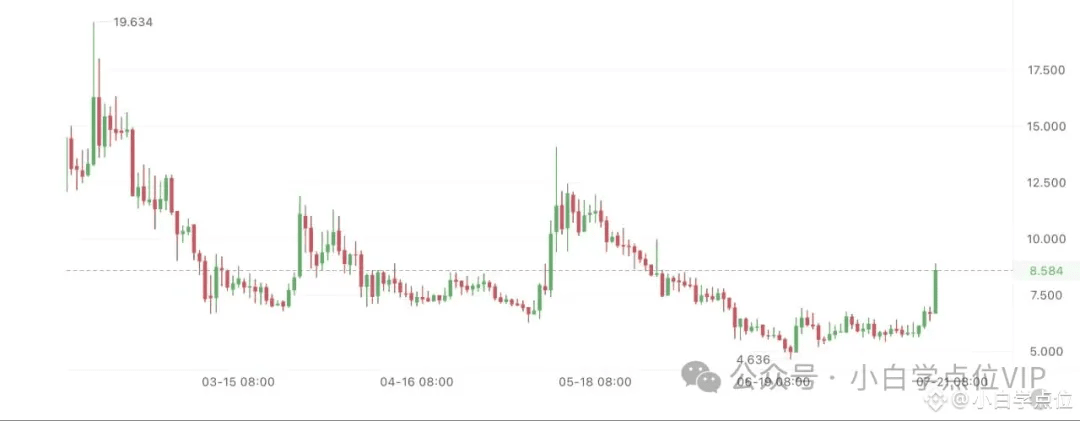
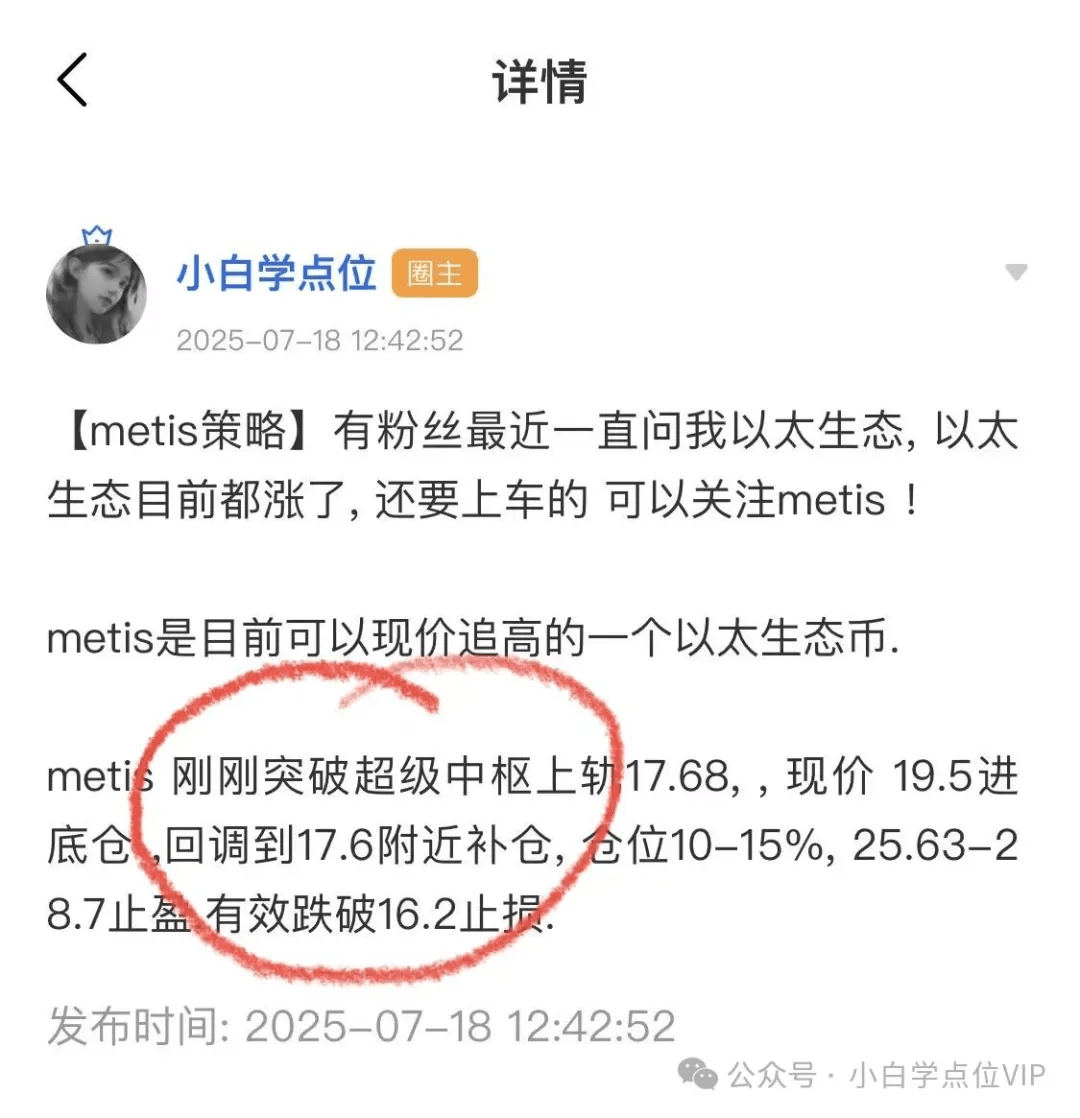
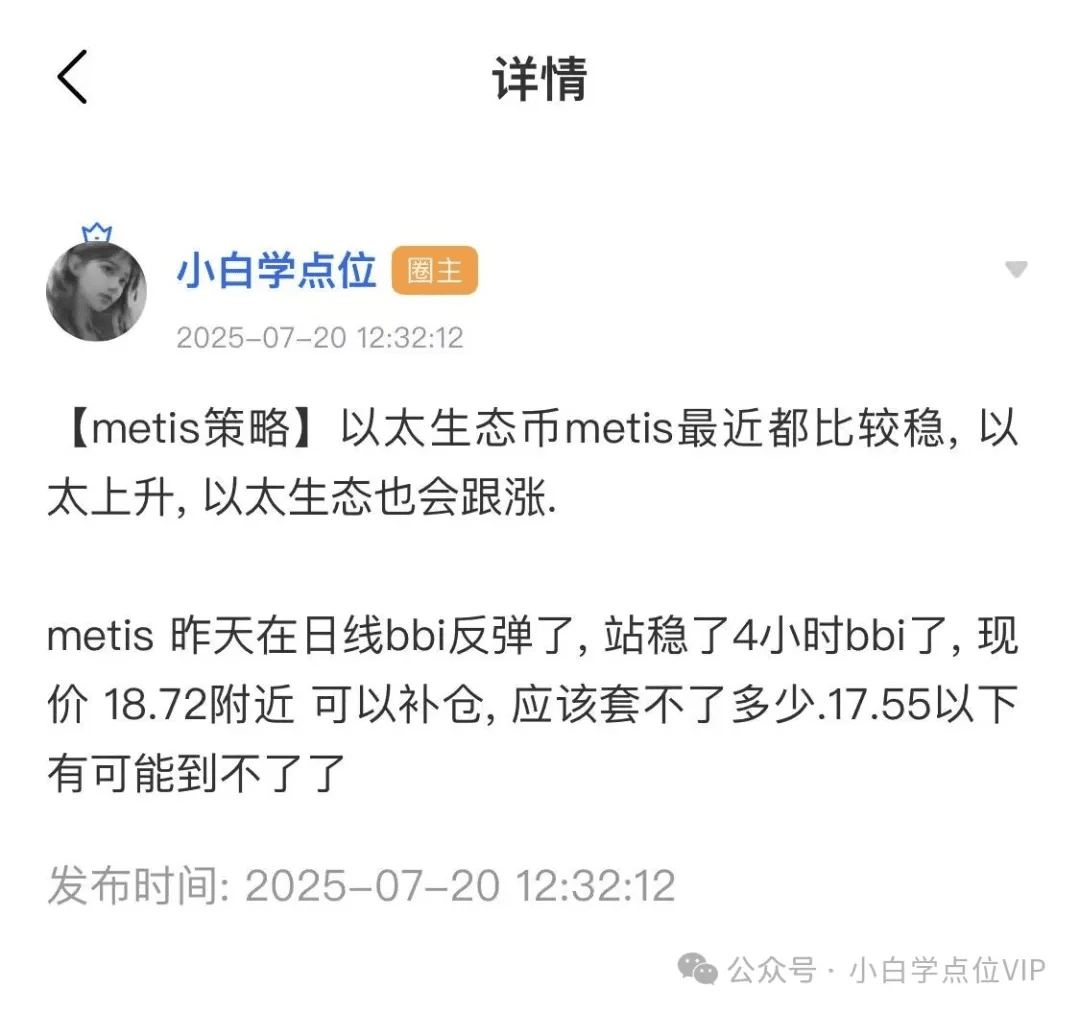
(4) Metis connected exactly at the minimum of 17.6; it reminded to connect again before the rise!
(5) virtual lived up to expectations, successfully connecting at a minimum of 1.6829, popcat at a minimum of 0.3691, mission accomplished!

WIF has also risen sharply; how could we miss out on POPCAT? This is the leader of MEME fish and shrimp! How could the big MEME fish and shrimp market miss out on POPCAT? This morning, latecomers were still connected with POPCAT!

(6) Thoughts on fish, shrimp, and crabs connections and priority configurations
In addition, many fish, shrimp, and crabs have also experienced varying degrees of rise; I won't enumerate them all. The fish, shrimp, and crabs we are involved with are detailed in the article (Auntie's significant rise of 3600+, how much longer can it last? You can't imagine Auntie's two long-term scripts! Bull Demon King, XRP, and SOL analysis! The season for the fish, shrimp, and crabs you mentioned has arrived!) which provided ideas and priority configurations:

Three, when to escape the altcoin peak?
The article (Auntie's significant rise of 3600+, how much longer can it last? You can't imagine Auntie's two long-term scripts! Bull Demon King, XRP, and SOL analysis! The season for the fish, shrimp, and crabs you mentioned has arrived!) provided ideas:

The entire rise of the Bull Demon King and Auntie's wave 5 is expected to end the earliest after July 25-26, and at the latest around August 1.
Before this, there was nothing to do but be friends with fish, shrimp, and crabs! Wait until Auntie's 5-3 or 5-5 wave ends to escape!
Four, how to distinguish whether this is a bull or bear?
Many people keep asking me repeatedly: [Is this a bull or a bear]?
This round of bull and bear markets is much more complex than the past three rounds; each role needs to be analyzed separately. You cannot simply look at the Bull Demon King to analyze the bull and bear of fish, shrimp, and crabs, nor can you simply look at Auntie. Otherwise, your judgment will be wrong and you will feel very uncomfortable!
In the upcoming chapters, I will share my judgments on [Is the Bull Demon King a bull or a bear?], [Is Auntie a bull or a bear?], and [Are fish, shrimp, and crabs a bull or a bear?]!
Five, is Bitcoin a bull or a bear?
Last week's article (accurately predicting the Bull Demon King will appear in wave 3-5 on July 13-14! Fish and shrimp should be cautious on July 11 or 14, as it approaches the ultimate peak!) pointed out that the Bull Demon King has three scripts. Unfortunately, the chart was given, but many people couldn't understand it!
(The three pictures below are identical; the reason for copying three pictures is that the text is too long, making it easier for everyone to compare)
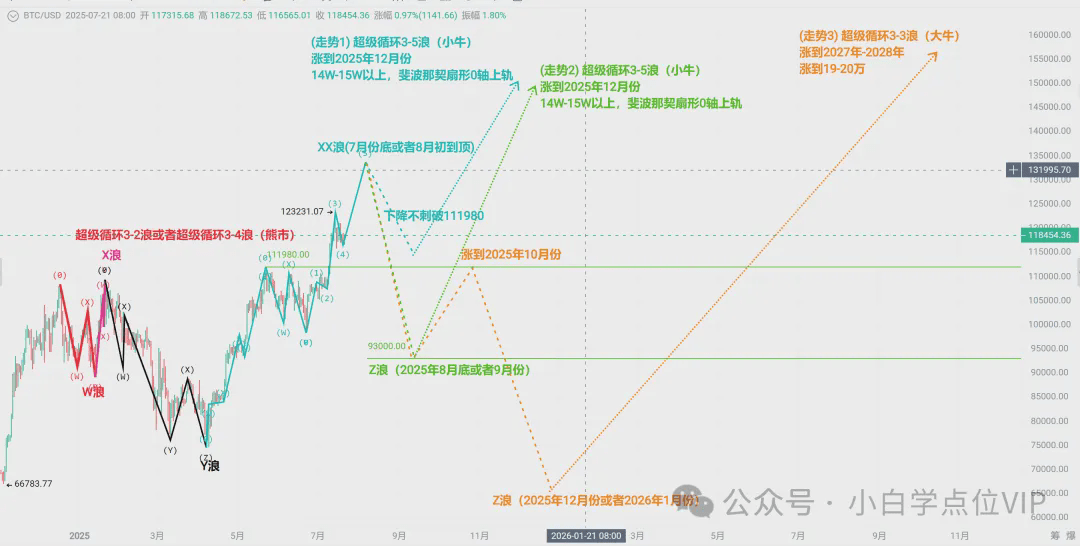
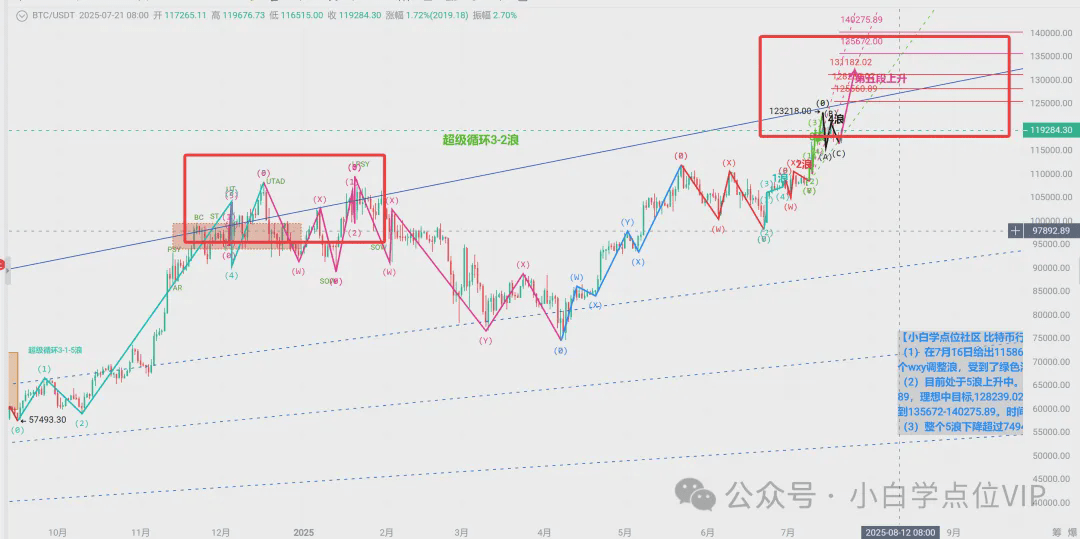
(1) The trend of the cyan line in the figure indicates that the Bull Demon King is performing well; it is currently in the bull market of the super cycle 3-5 wave, which is the last wave of the entire super cycle 3 bull market. We refer to this as a small bull.
In this scenario, the Bull Demon King is currently in the upward phase of the super cycle 3-5-3 wave, and the Bull Demon King will reach around 130K at the upper track of the Fibonacci fan's 0-axis, and then end the super cycle 3-5-3 wave. The end time node is at the end of July or early August.
The decline of the super cycle 3-5-4 wave will not pierce 111980, with an end time node in late August or September.
The upward target for the super cycle 3-5-5 wave is above 140K-150K, located above the upper track of the Fibonacci fan's 0-axis, with an end time node in October-December.
After the end of the super cycle 3-5 wave, we will enter the great bear market of the super cycle 4 wave!
After the bear market of the super cycle 4 wave ends, we will enter the bull market of the super cycle 5 wave!
(2) The green line in the figure is currently in the adjustment of the super cycle 3-4 bear market. This script shows that the Bull Demon King is still in the bear market of the super cycle 3-4-XX! The bear market also has upward movements; the rise of the super cycle 3-4-XX is very fierce, comparable to a bull market! In terms of real sensation and effect, you can consider it a bull market; technically, you must consider it a bear market.
The Bull Demon King's super cycle 3-4-XX wave will end at around 130K, near the upper track of the Fibonacci fan's 0-axis, with an end time node at the end of July or early August.
The decline of the super cycle 3-4-Z wave must pierce 111980, ideally reaching the CME gap located around 92000-93000, with an end time node in late August or September.
After the end of the super cycle 3-4-Z wave, we will enter the upward phase of the super cycle 3-5 wave. The super cycle 3-5 wave is the last wave of the entire super cycle 3 bull market, referred to as a small bull! The upward target for the super cycle 3-5 wave is above 140K-150K, located above the upper track of the Fibonacci fan's 0-axis, with an end time node in October-December.
After the end of the super cycle 3-5 wave, we will enter the great bear market of the super cycle 4 wave!
After the bear market of the super cycle 4 wave ends, we will enter the bull market of the super cycle 5 wave!
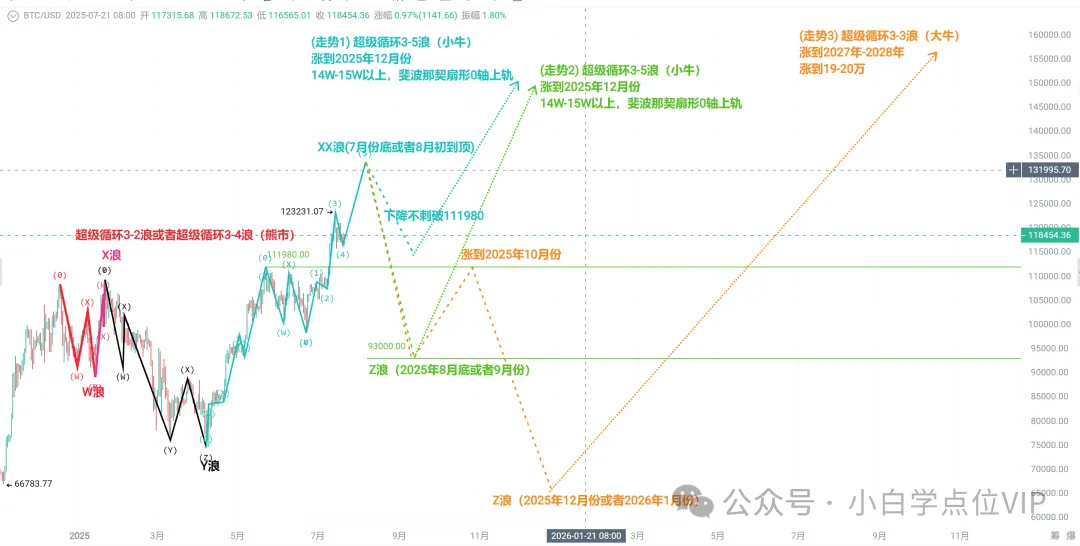
(3) The orange line in the figure is currently in the adjustment of the super cycle 3-2 bear market. This script shows that the Bull Demon King is still in the bear market of the super cycle 3-2-XX! The bear market also has upward movements; the rise of the super cycle 3-2-XX is very fierce, comparable to a bull market! In terms of real sensation and effect, you can consider it a bull market; technically, you must consider it a bear market.
The Bull Demon King's super cycle 3-2-XX wave will end at around 130K, near the upper track of the Fibonacci fan's 0-axis, with an end time node at the end of July or early August.
The decline of the super cycle 3-2-Z wave must pierce 111980, ideally reaching the CME gap located around 92000-93000 by late August or September, and then start a rising continuation from the decline, rising to around 111980 in October, forming a head and shoulders top.
The super cycle 3-2-Z wave will continue to decline starting in November, reaching the bottom in December 2025 or January 2026, with the final decline position possibly below 74508 or not below 74508; in other words, falling below 74508 is not mandatory!
The super cycle 3-2-Z wave ends, and then it enters the upward phase of the super cycle 3-3 wave. The super cycle 3-3 wave is the one with the largest absolute rise in the entire super cycle 3 bull market, which we call the big bull!
The upward target for the super cycle 3-3 wave is above 190K-200K, located above the upper track of the Fibonacci fan's 0-axis, with an end time node in 2027-2028, making the upward time long!
After the end of the super cycle 3-5 wave, we will enter the great bear market of the super cycle 4 wave!
After the bear market of the super cycle 4 wave ends, we will enter the bull market of the super cycle 5 wave!
Six, is Ethereum a bull or a bear?
The article (Auntie's significant rise of 3600+, how much longer can it last? You can't imagine Auntie's two long-term scripts! Bull Demon King, XRP, and SOL analysis! The season for the fish, shrimp, and crabs you mentioned has arrived!) proposed [Auntie's two long-term scripts]:
<1> [Auntie's Pessimistic Long-Term Wave 4 Trend Script]
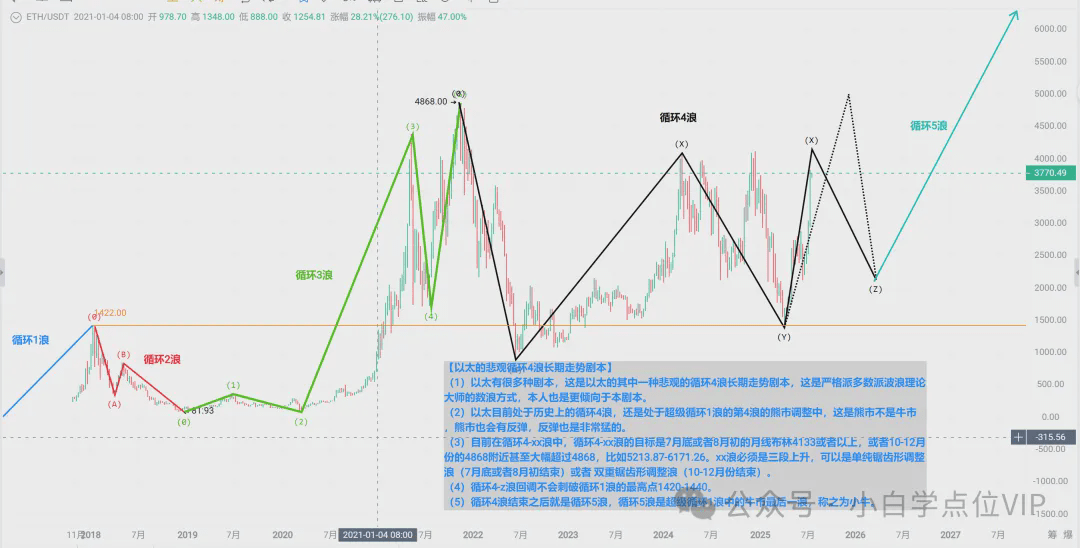
(1) Auntie has many scripts; this is one of Auntie's pessimistic long-term wave 4 trend scripts. This is the counting method of the strict majority wave theory masters, and I also tend to this script.
(2) Currently in the historical cycle of wave 4, still in the bear market adjustment of the 4th wave of the super cycle 1; this is a bear market, not a bull market. The bear market will also have rises, and the rise is also very fierce.
The rise of cycle 4-xx wave is very fierce, comparable to a bull market! In terms of real sensation and effect, you can consider it a bull market; technically, you must consider it a bear market.
(3) Currently in cycle 4-xx, the target for cycle 4-xx is the monthly Bollinger at 4133 or above at the end of July or early August, or around 4868 in October-December, or even significantly exceeding 4868, such as 5213.87-6171.26.
The x wave must be a three-segment rise, which can be a simple zigzag adjustment wave (ending around late July or early August) or a double zigzag adjustment wave (ending in October-December).
(4) The decline of the cycle 4-z wave will not pierce the highest point of cycle 1 at 1420-1440.
(5) After the end of cycle 4, there will be cycle 5; cycle 5 is the last wave of the bull market in the super cycle 1, known as the small bull.
<2> [Auntie's Optimistic Long-Term Wave 5-3 Trend Script]
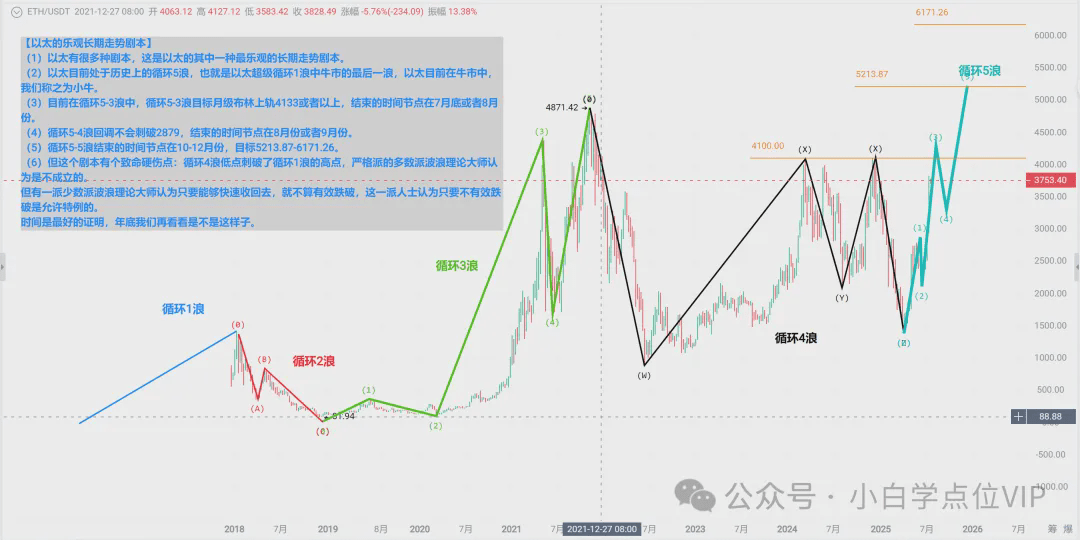
(1) Auntie has many scripts; this is one of Auntie's most optimistic long-term wave 5-3 trend scripts.
(2) Currently in the historical cycle of wave 5, which is the last wave of the bull market in the super cycle of wave 1. Auntie is currently in a bull market, which we refer to as a small bull.
(3) Currently in the cycle of wave 5-3, the target for wave 5-3 is the monthly Bollinger upper track at 4133 or above, with an end time node at the end of July or August.
(4) The decline of cycle 5-4 will not pierce 2879, with the end time node in late August or September.
(5) The time node for the end of the cycle 5-5 wave is in October-December, with targets of 5213.87-6171.26.
(6) But this script has a fatal flaw: in non-leading wedge shapes, the low point of cycle 4 pierced the highest peak of cycle 1, which most strict wave theory masters believe is invalid.
However, a minority of wave theory masters believe that as long as it can be quickly recovered, it is not considered an effective breakdown. This group believes that as long as it does not break down effectively for a long time, exceptions are allowed. This group is mainly found in cash/assets and debt futures and options.
I don't quite agree with this statement; it goes against the original intention of Elliot's three major rules of wave theory.
Especially in this non-minute chart, it is neither futures nor options, and such a situation should not be allowed; otherwise, the world will be in chaos.
Time is the best proof; we will see if this is the case by the end of the year.
Seven, are altcoins a bull or a bear?
Are fish, shrimp, and crabs in a bear market or a bull market? Don't look at the Bull Demon King, and don't look at Auntie; they must be analyzed separately. The only basis for ultimately judging whether fish, shrimp, and crabs are in a bear or bull market are the three Secret Diagrams!
The three Secret Diagrams were first introduced in the article (98399.23 once again seals the god; this is just the beginning, not the end! The bear path is long; when will the season for fish and shrimp arrive? The three Secret Diagrams reveal the cruel truth!).
The Bull Demon King is the Bull Demon King, Auntie is Auntie, stable fish and shrimp are stable fish and shrimp, and ordinary fish and shrimp are ordinary fish and shrimp! Don't think that because the Bull Demon King and Auntie have strong trends, the bull market for fish, shrimp, and crabs has arrived; the truth is far from what you imagine!
Conclusion: Fish, shrimp, and crabs are still in a bear market, not a bull market!

What standard should be used to quantify the performance of fish, shrimp, and crabs? This chapter is very important; everyone should read it carefully!
(1) The bottoming period when the bear turns into a bull
The bottoming period when the bear turns into a bull refers to [after the last small bull appears, the decline is no longer massive enough to cause despair, with a very clear bottom; anyone can know that it is the lowest point, and the larger the market value, the more obvious the bottom. However, this phase will repeatedly annoyingly oscillate, and many will not escape the oscillation range for a long time].
This is the accumulation period of the Zhuang family, which is the most grueling period; it can easily wash people off the bus. You can use wave theory + Gann theory + Wyckoff accumulation model + Chán theory + high win rate trading models to comprehensively connect. The real take-off stage of the big bull market comes after the bottoming period!
Historically, the bottoming period when the bear turns into a bull is 8-9 months; can you endure it?
(2) The overall situation of ordinary fish, shrimp, and crabs: The Secret Diagram (fish and shrimp ranked within the top 50 by market value)
To analyze the overall situation of fish, shrimp, and crabs, it is necessary to exclude the Bull Demon King, Auntie, and various stable fish, shrimp, and crabs from the overall market value of fish, shrimp, and crabs in the Block Continent; this is the true overall market value situation of ordinary fish, shrimp, and crabs.
In theory, we should also remove XRP and BNB, which have very large market values; otherwise, it will cause a certain degree of distortion. However, in actual operations, I don't see chart data sources that meet my requirements, so I can only give up.
As shown in the figure, everyone should understand it well; the latest chart has been updated, representing the overall situation of fish, shrimp, and crabs within the top 50 by market value:
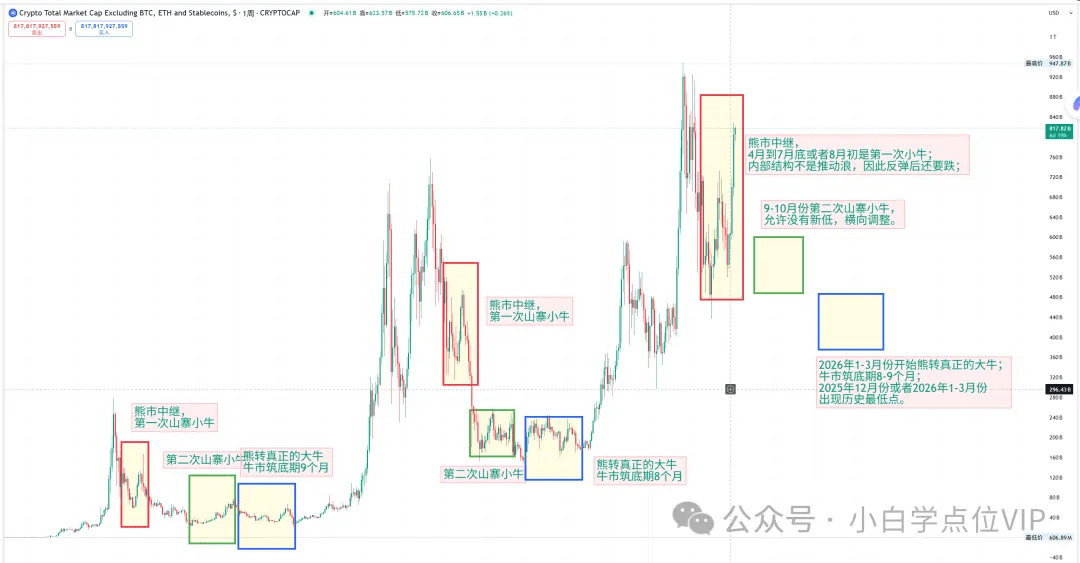
From April to the end of July or early August is the first small bull. The internal structure is not a driving wave, so after the rise, there will be a decline.
In September-October, the second small bull for fish, shrimp, and crabs is allowed without a new low, with horizontal adjustment.
Starting from January to March 2026, the bear will turn into a true bull; the bull market bottoming period is 8-9 months; the historical lowest point will appear in December 2025 or January-March 2026.
(3) Small-cap fish and shrimp situation: The Secret Diagram (fish and shrimp ranked 50-100 by market value)
Based on the overall market situation of ordinary fish, shrimp, and crabs, further exclude the fish, shrimp, and crabs in the top 50 by market value to obtain the overall situation of small-cap fish, shrimp, and crabs ranked 50-100 by market value. As shown in the figure, everyone should understand it well; the latest chart has been updated:
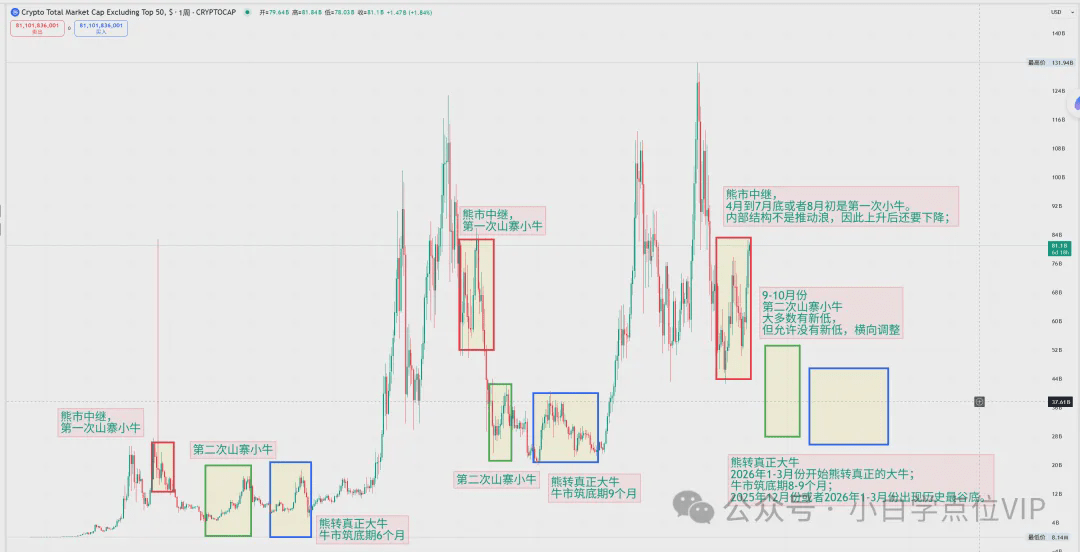
From April to the end of July or early August is the first small bull. The internal structure is not a driving wave, so after the rise, there will be a decline.
In September-October, the second small bull for fish, shrimp, and crabs is allowed without a new low, with horizontal adjustment.
Starting from January to March 2026, the bear will turn into a true bull; the bull market bottoming period is 8-9 months; the historical lowest point will appear in December 2025 or January-March 2026.
Small-cap fish and shrimp in the small bull rise overall are slightly worse than the overall market value situation of ordinary fish and shrimp, which means if you are uncertain, the cost performance of getting involved with fish, shrimp, and crabs in the top 50 by market value during the bear market small bull is better and more certain.
(4) Micro fish and shrimp situation: The Secret Diagram (fish and shrimp ranked 100 and below)
Based on the overall situation of ordinary fish, shrimp, and crabs, further exclude the fish, shrimp, and crabs in the top 100 by market value to obtain the overall situation of micro fish, shrimp, and crabs ranked after 100 by market value. As shown in the figure, everyone should understand it well; this chart is the one we should study repeatedly, and the latest chart has been updated:
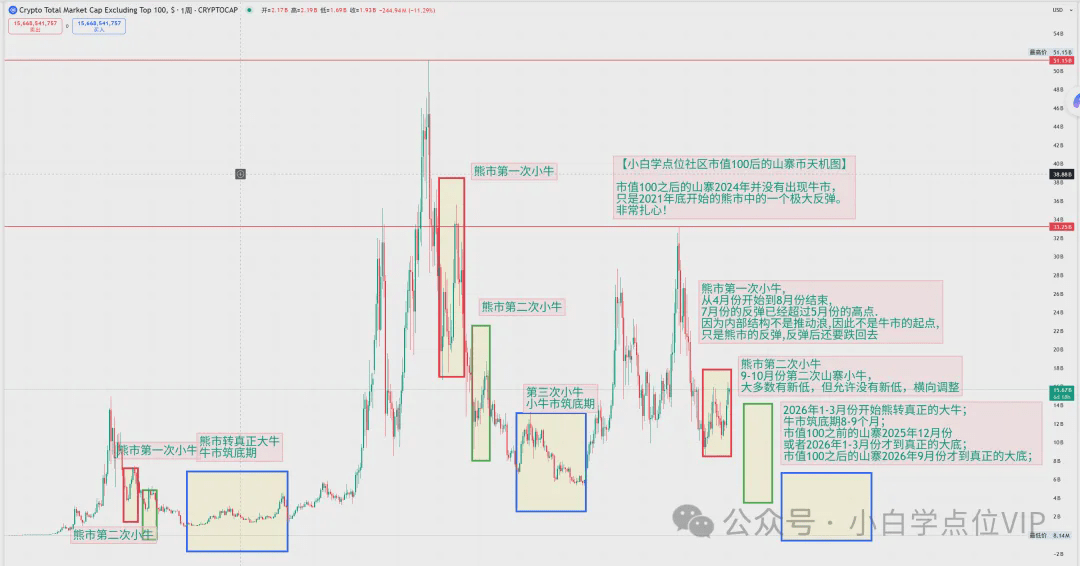
From April to the end of July or early August is the first small bull for fish, shrimp, and crabs. The rise in July has already exceeded the high point in May. This means that most fish and shrimp can exceed the high point in May; those that cannot exceed the high point in May are weak and unqualified fish and shrimp! The internal structure is not a driving wave, so after the rise, there will be a decline.
In September-October, the second small bull for fish, shrimp, and crabs is allowed without a new low, with horizontal adjustment.
Starting from January to March 2026, the bear will turn into a true bull; the bull market bottoming period is 8-9 months.
Fish, shrimp, and crabs before reaching a market value of 100 will only reach the true bottom in December 2025 or January-March 2026.
For micro fish, shrimp, and crabs after reaching a market value of 100, the true bottom will not be reached until September 2026.
After reaching a market value of 100, micro fish, shrimp, and crabs did not experience a bull market in 2024; it was just a significant rise in the bear market that began at the end of 2021, which is very heartbreaking and despairing!
Micro fish, shrimp, and crabs in the small bull rise overall are much worse than small-cap fish, shrimp, and crabs, which means if you're uncertain, it is not advisable to get involved with fish, shrimp, and crabs with a market value above 100 during the bear market small bull; the uncertainty is high, making it easy to follow downward instead of upward.
(5) Conclusion
The way of heaven has cycles; if carving a boat to seek a sword works, my suggestion is:
In September-October 2025, there will be a second small bull for fish, shrimp, and crabs. During the small bull period, if you are uncertain, it is recommended to get involved with fish, shrimp, and crabs with a market value of 50 or less; next, those in the top 100 by market value; it is not advisable to get involved with fish, shrimp, and crabs with a market value above 100.
<2> In December 2025 or January-March 2026, there will be a third small bull. During the small bull period, if you are uncertain, it is recommended to get involved with fish, shrimp, and crabs in the top 50 by market value, followed by those in the top 100. It is not advisable to get involved with fish, shrimp, and crabs with a market value above 100.
<3> After the end of the third small bull, the period before September-October 2026 is the bottoming period for the bear turning into a big bull. Before September-October 2026, it is necessary to rationally allocate connections among the Bull Demon King, Auntie, fish, shrimp, and crabs in the top 50 by market value, those in the top 100, and those above 100, striving to obtain a greater upward amplitude based on the bottom guarantee!
<4> What fish, shrimp, and crabs should we specifically connect with at each stage? Everyone should think for themselves; the private circle will provide more detailed idiot-style guidance (sector pairing, fish, shrimp, and crab pairing, connection timing and positions, disconnection timing and positions, wave analysis charts, comprehensive predictions of time and space, etc.)!
Eight, short-term analysis of Bitcoin trends
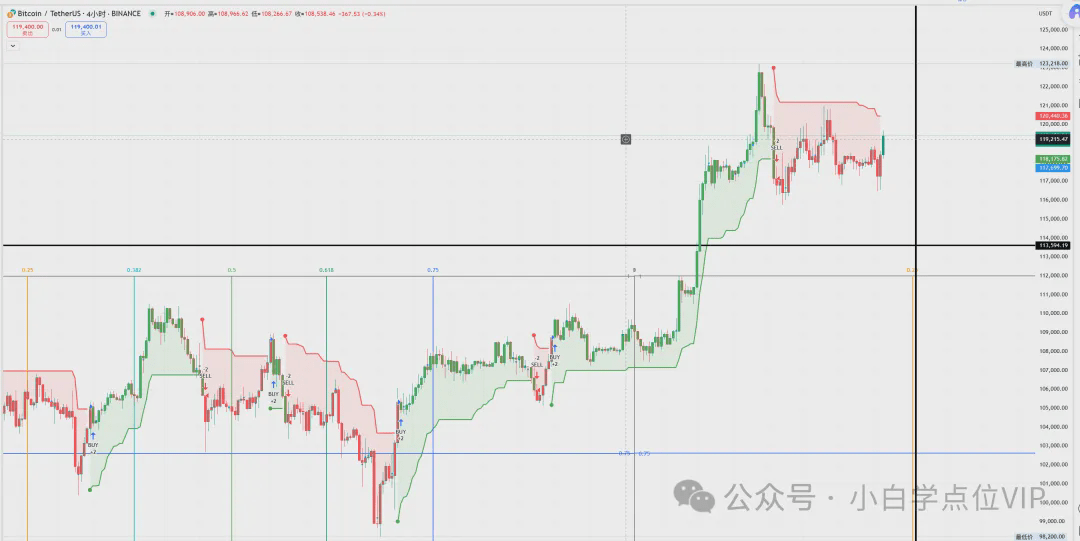
<1> [Wave Trend Analysis]
The short-term wave trend is as follows:
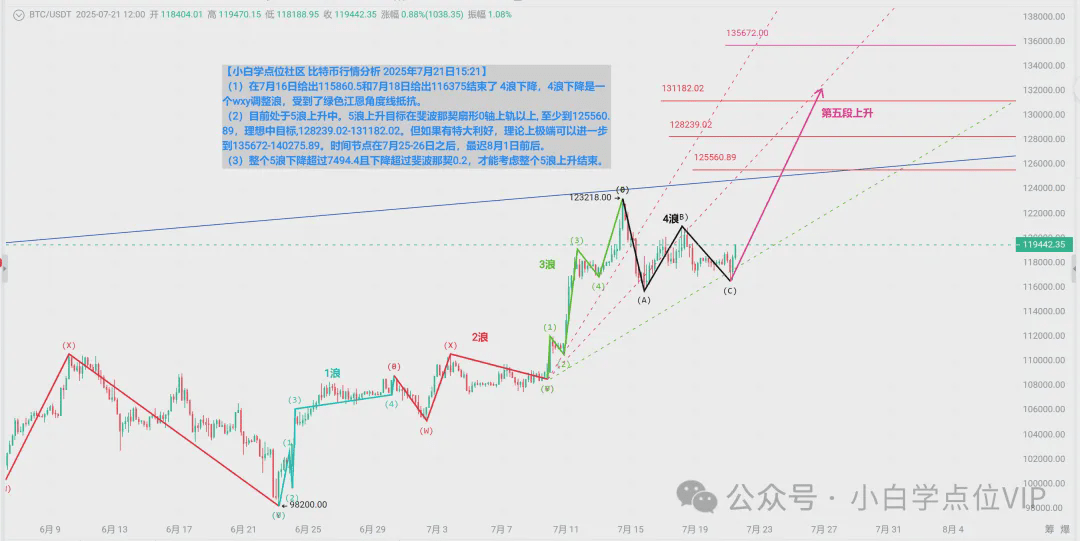
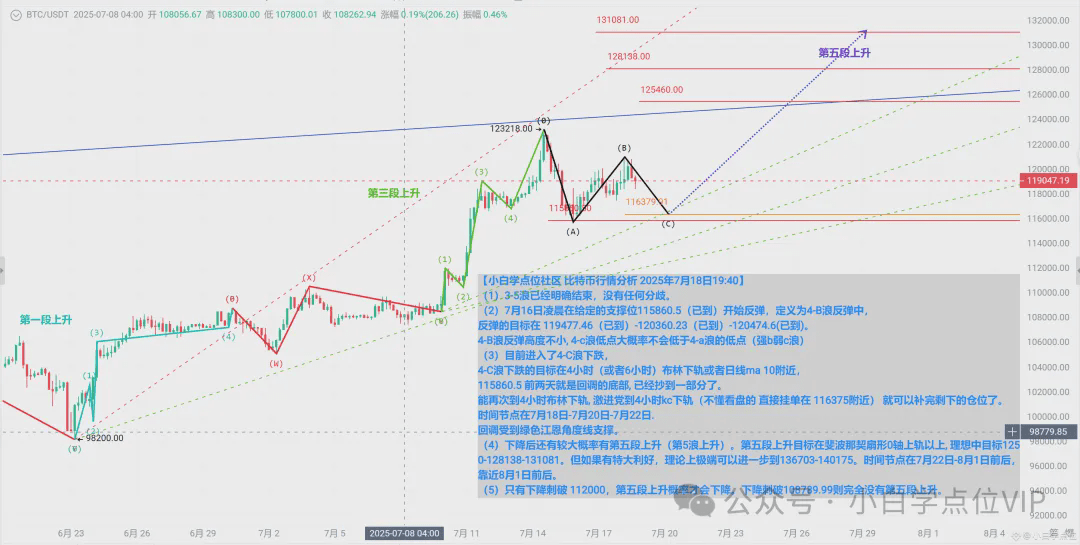
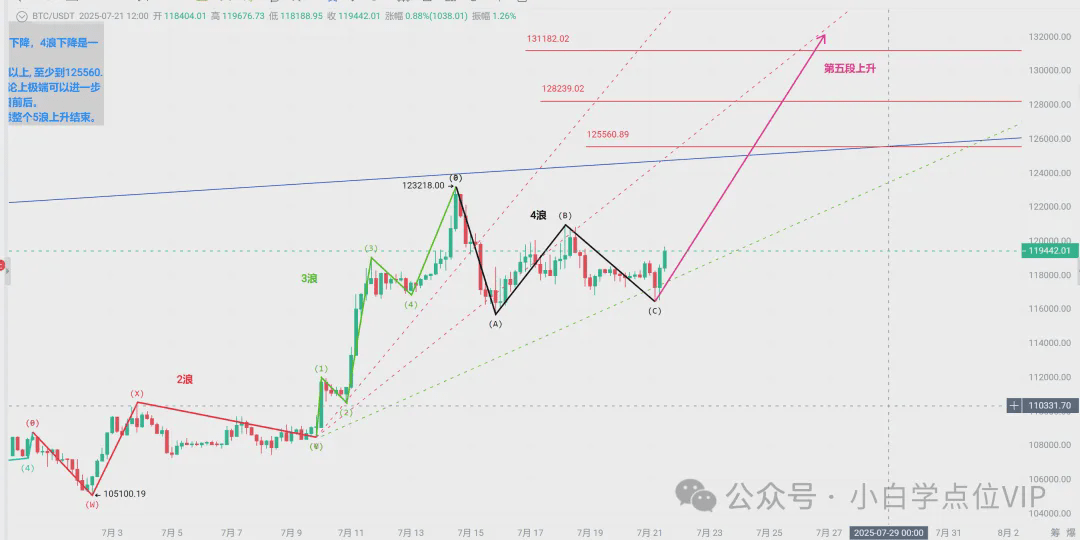
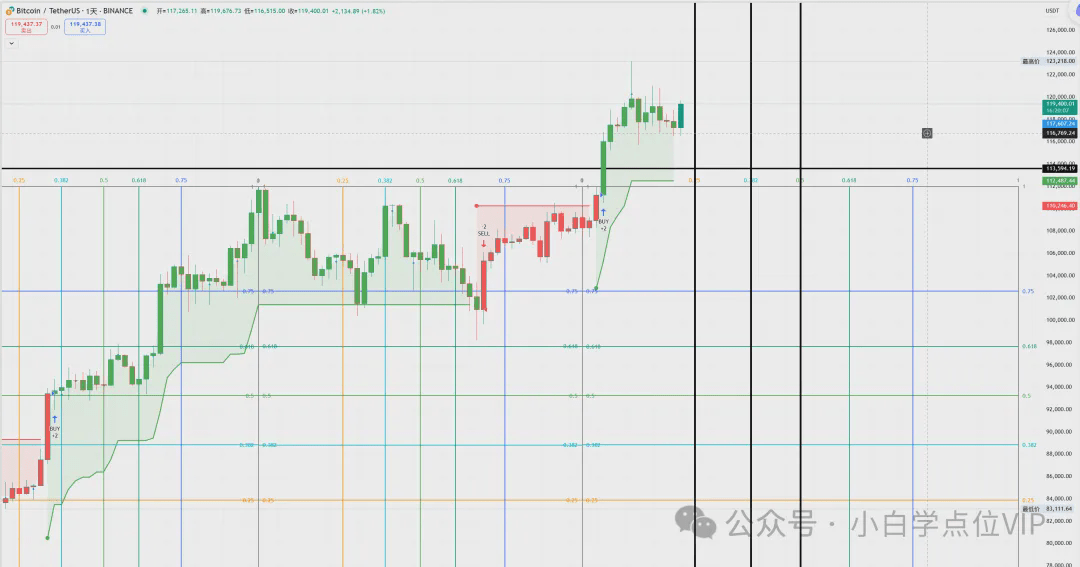
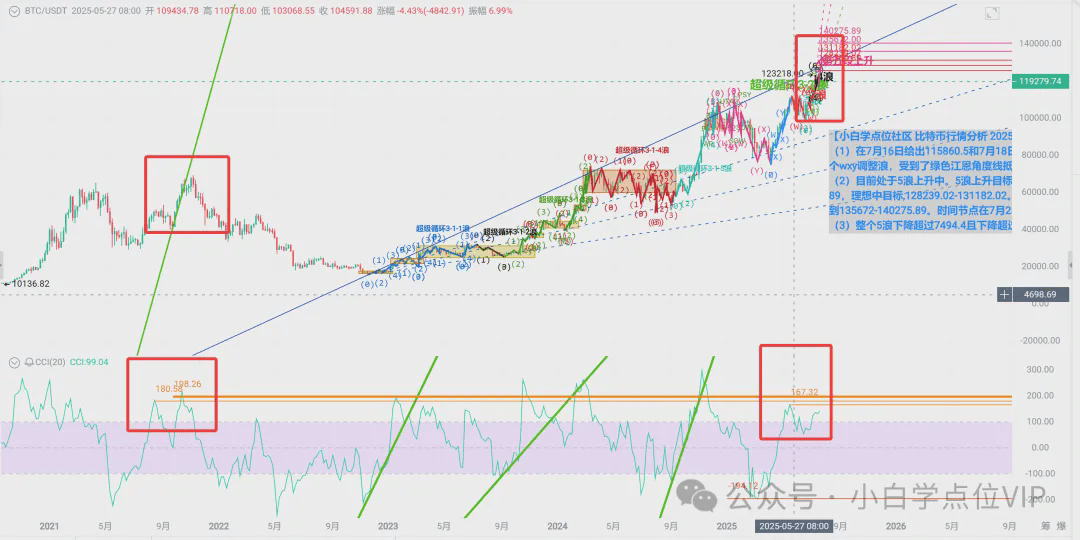
(1) On July 16, 115860.5 was given, and on July 18, 116375 ended the decline of wave 4. The decline of wave 4 was a wxy adjustment wave, resisted by the green Gann angle line.
(2) Currently in wave 5 rising. The target for wave 5 is above the upper track of the Fibonacci fan's 0-axis, at least reaching 125560.89, ideally at 128239.02-131182.02. However, with significant positive news, theoretically, it could further reach 135672-140275.89. The time node is after July 25-26, at the latest around August 1.
(3) The entire decline of wave 5 must exceed 7494.4 and exceed Fibonacci 0.2 before considering the end of the entire rise of wave 5.
<2> [Wyckoff Accumulation Model Analysis]
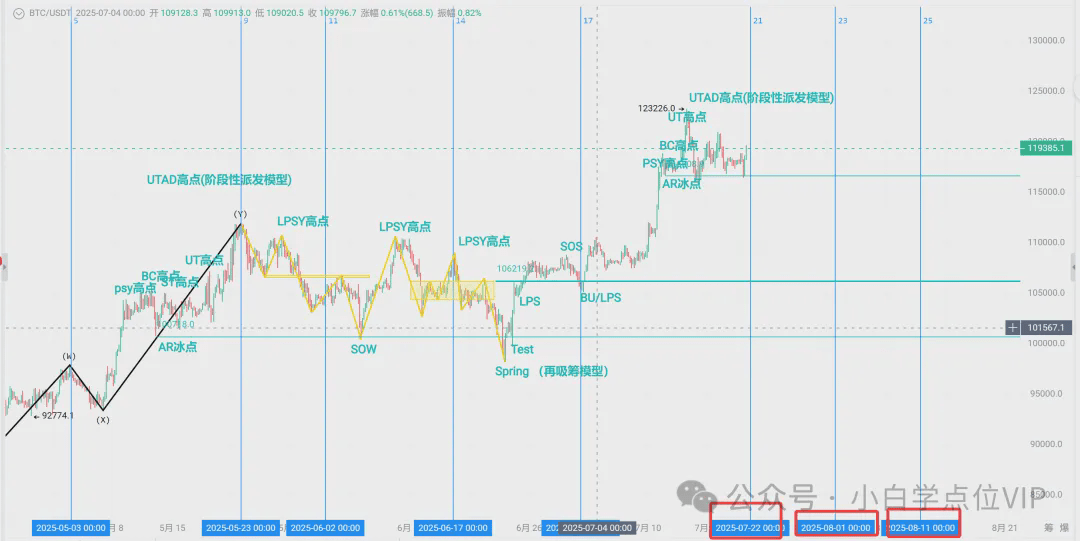
The Bull Demon King's [Wyckoff Re-Accumulation Model] is shown in the diagram below:
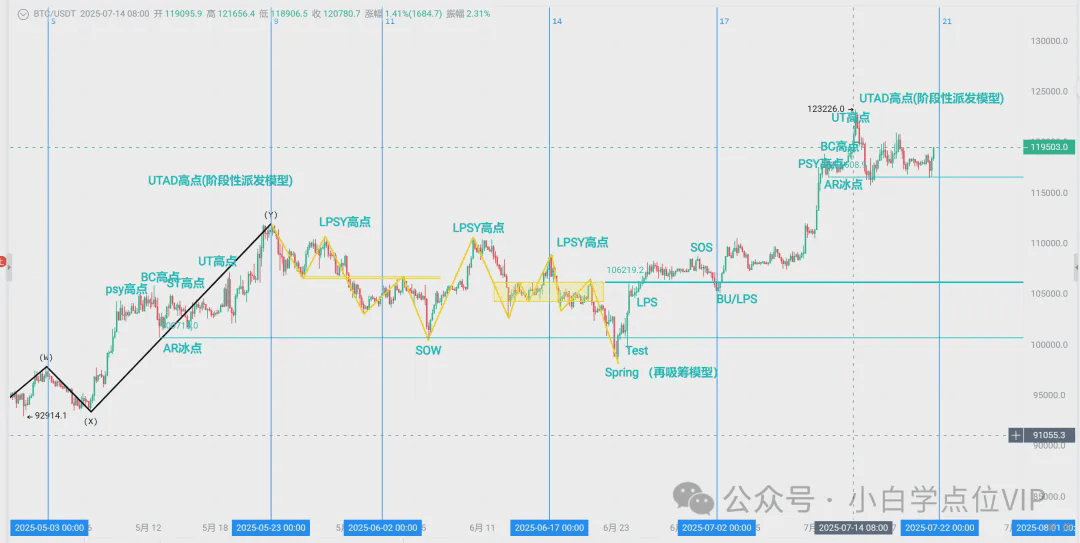
After 98200 is the Wyckoff Accumulation Model; 98200 is a spring effect, followed by another test, LPS appears near 104623, SOS appears at 108275, and BU/LPS appears near 105100.
A phased distribution has appeared on the hourly level (which can be called distribution continuation), but this is not the final distribution.
The emergence of the high points of psy, bc, ST, UT, and UTAD appeared in sequence. 106608.9 is the AR ice point; in fact, it also ended the distribution near the AR ice point, resulting in a new round of rises, perfectly fitting the Wyckoff model.
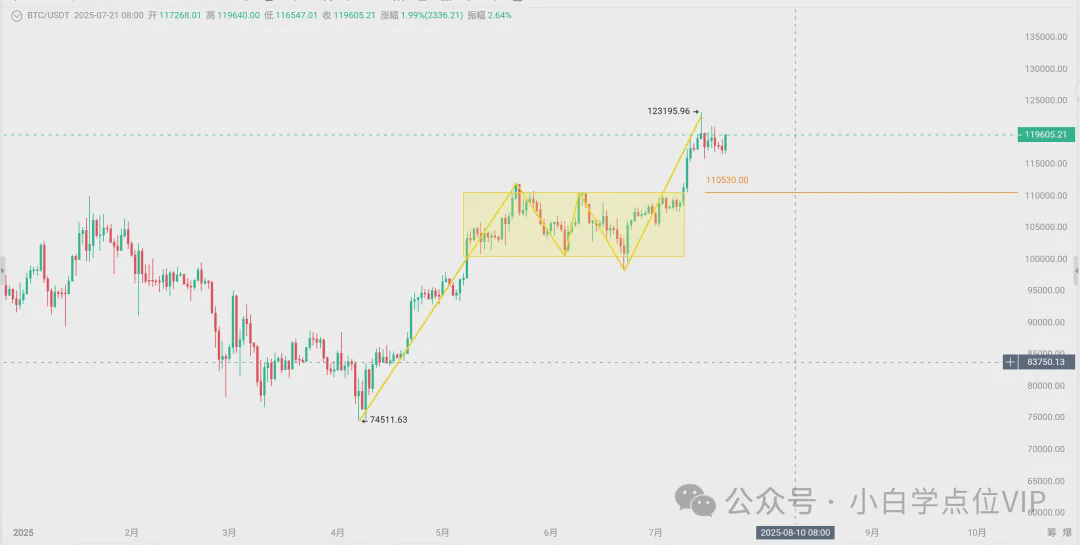
[Chán Theory Trend Analysis]
From the perspective of the Chán Theory, a daily central point has formed, with the upper track of the central point at 110530. As long as it does not fall back to 110530, the upward trend is not considered over.
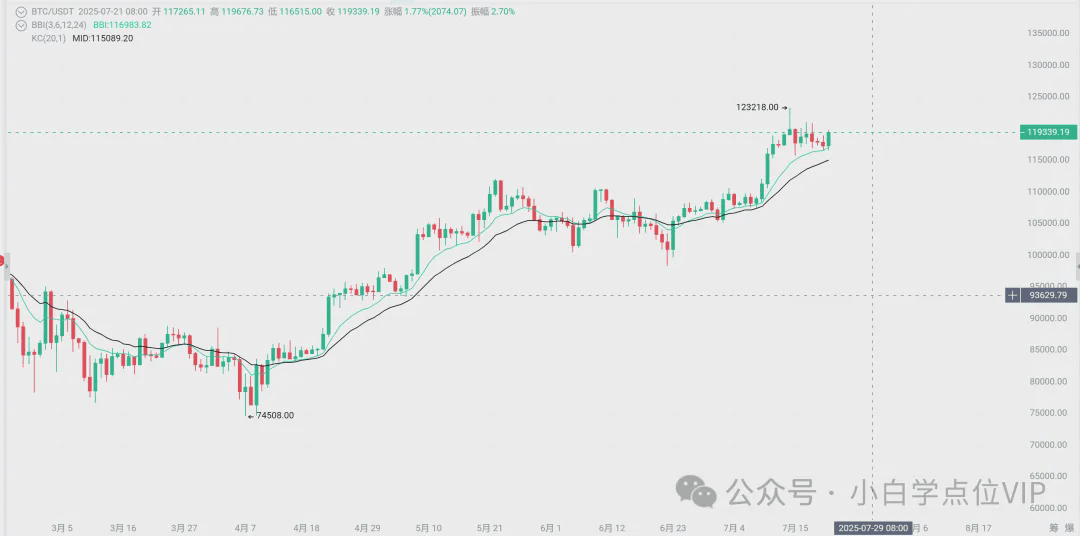
[BBI Analysis]
The daily BBI key resistance is currently at 117014. There have been several clear resistances near the daily BBI! Only by losing the daily BBI for multiple days could the upward trend potentially end.
<4> [Gann Theory + Fibonacci Sequence Analysis]
(1) The Gann time series has significant turning points on July 22, August 1, and August 11.
July 22 confirmed a phase bottom. Pay special attention to August 1!
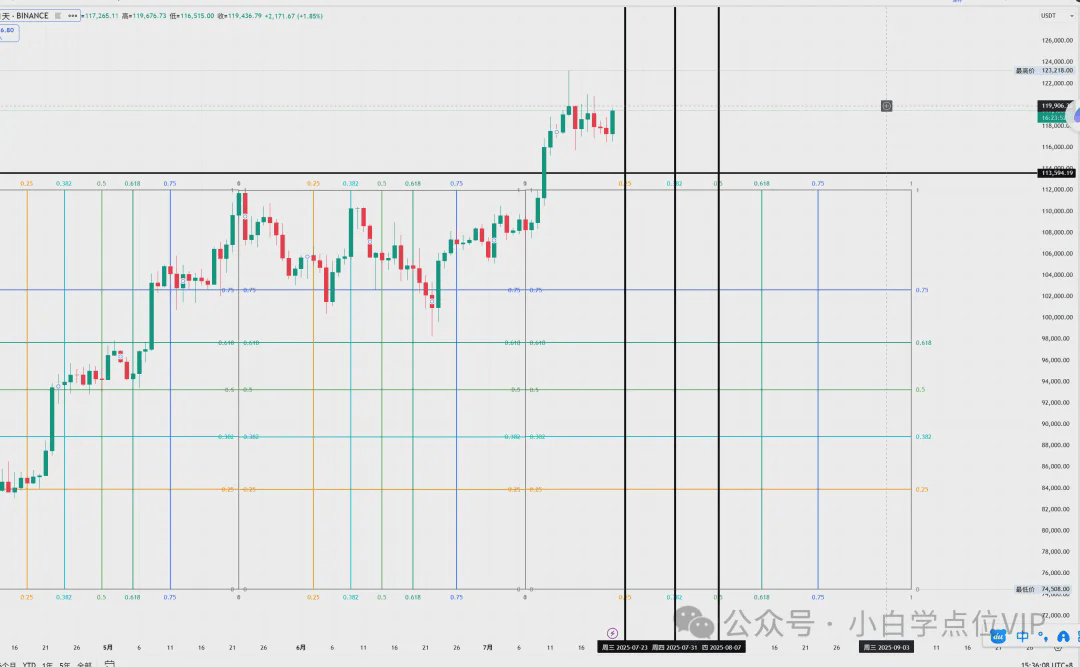
(2) July 23, July 31, and August 7 are important turning days in the Gann box:
(3) The rise of wave 5 is constrained by two purple-red Gann angle lines, and the decline is resisted by the green Gann angle line.
<5> [Trend Combination Strategy Indicator Analysis]
[Long-term Indicators] The 4-hour is in a violent state, the latest balance line of violent and enthusiastic is at 120440.36; once it breaks through, it will strengthen further.
[Long-term Indicators] The daily level is in a chasing state; the latest violent and chasing balance line is at 112482.44; unless it breaks, it cannot be said that the rise has ended.
<6> [Improved Kiss System Analysis]
Using BBI and the KC middle track to replace MA 5 and MA20 may filter frequent consolidation signals well and prevent premature exits.
The daily level can only represent re-entering consolidation if new flying kisses, wet kisses, or lip kisses are formed; otherwise, it will continue to rise.
<7> [Fibonacci Fan Analysis]
The upper track of the Fibonacci fan's 0-axis is near 125000, and it is about to be reached! Generally, it will end the rise at a distance above the upper track of the Fibonacci fan's 0-axis.
<8> [5-Day CCI Analysis]
The 5-day CCI is exactly like the second half of 2021; it could resemble the double peak of the 5-day CCI that appeared at the end of 2021!
If you carve a boat to seek a sword, then after the 5-day CCI is above 167.32, it will peak near 180.58-198.26.
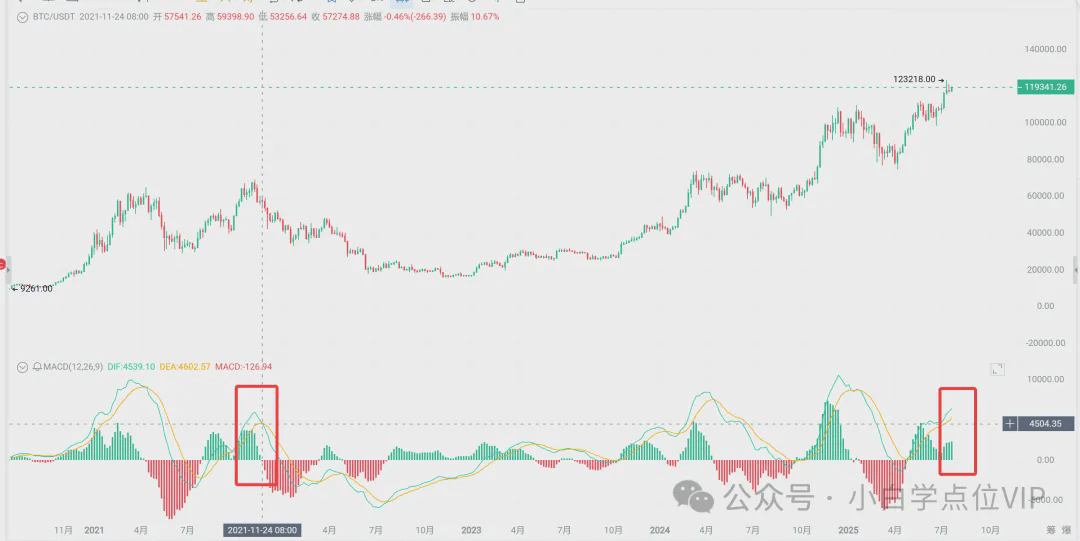
<9> [Weekly MACD Analysis]
The height of the green columns in the weekly MACD has significantly increased, similar to the large wave of rises that occurred at the end of 2021.
When will the weekly MACD show a death cross? The upward trend will end.
Nine, short-term analysis of Ethereum trends
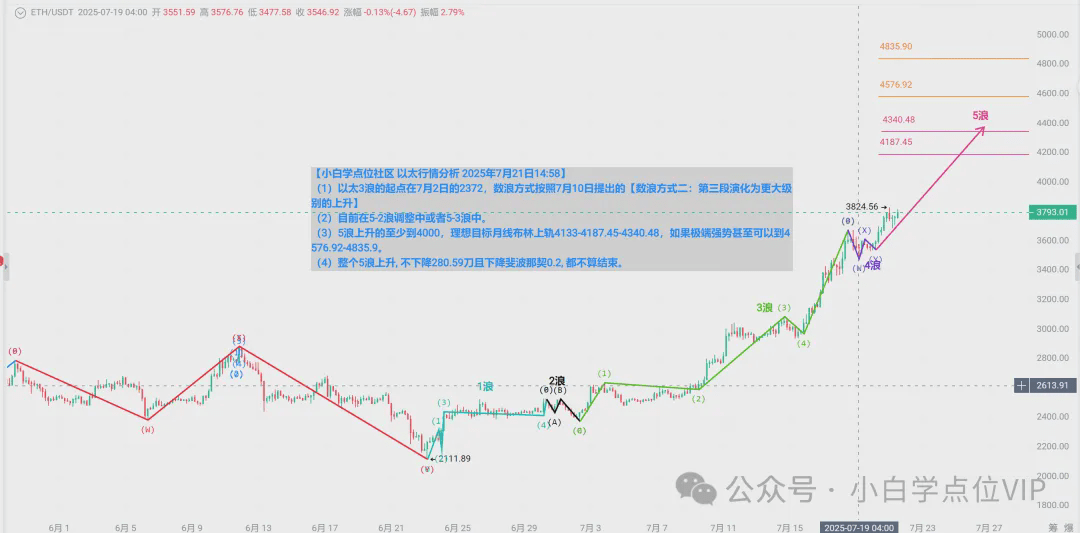
(1) The starting point of wave 3 is at 2372 on July 2, and the counting method follows the 'counting method two: the third segment evolves into a larger level of rising' proposed in the private circle on July 10.
(2) Currently in the 5-2 wave adjustment or 5-3 wave.
(3) The entire wave 5 rise is at least to 4000, with an ideal target near the monthly Bollinger upper track at 4133-4187.45-4340.48. If extremely strong, it could even reach 4576.92-4835.9. The time node is after July 25-26, at the latest around August 1.
(4) The entire rise of wave 5 should exceed 280.59 and also exceed the Fibonacci 0.2 before considering the end of the entire wave 5 rise.
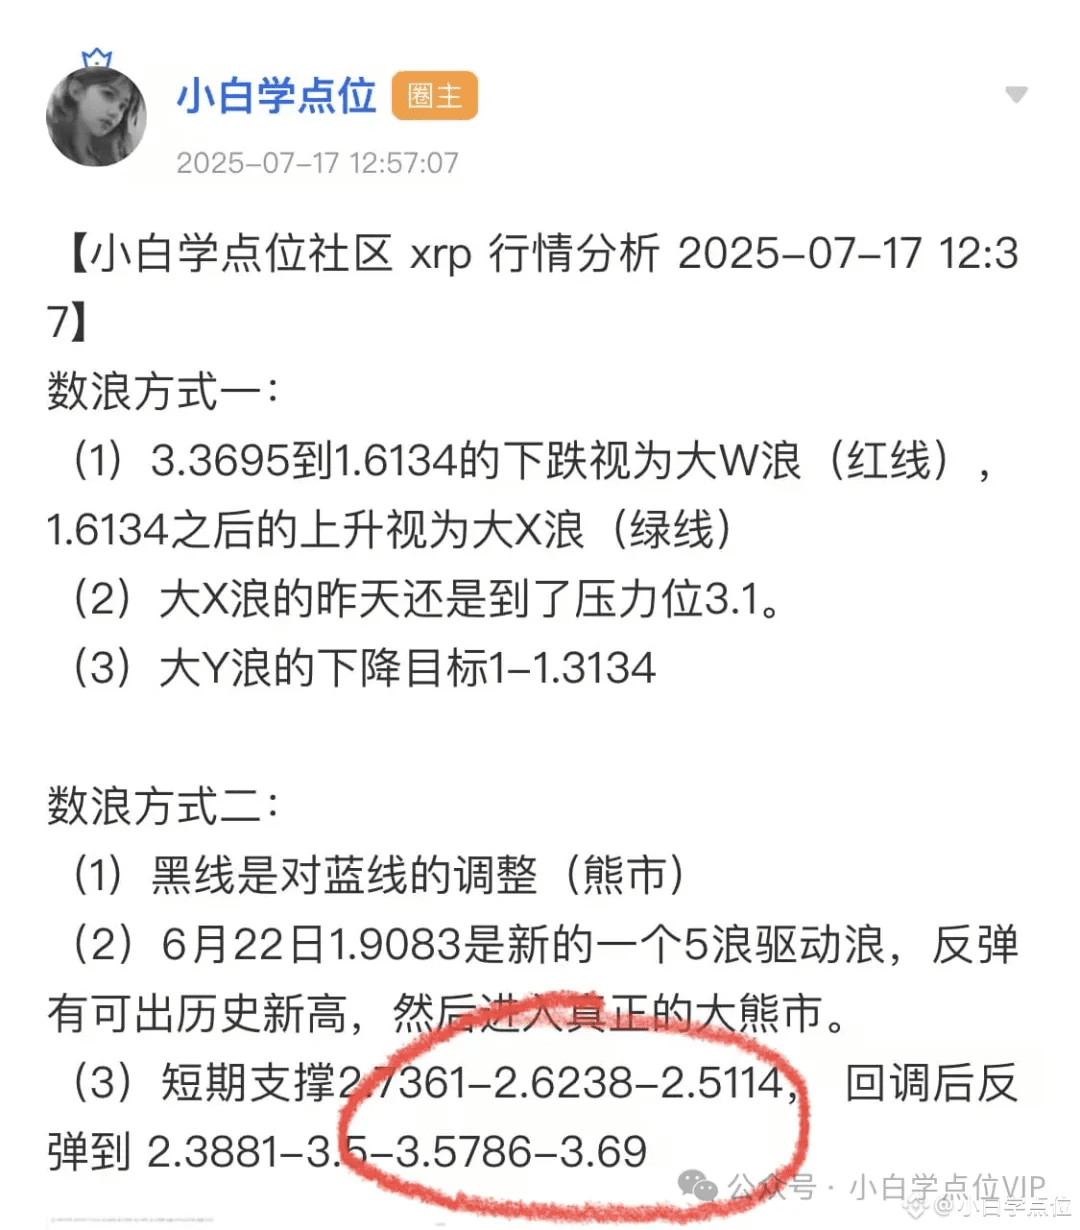
Ten, XRP reminds of historical highs at 3.69, ultimately reaching perfectly! Above 4 is not a dream!
XRP reminded on July 17 in the private circle that it could reach a historical high of 3.69.
In fact, 3.69 is not the highest point; there is still higher, and above 4 is not a problem.
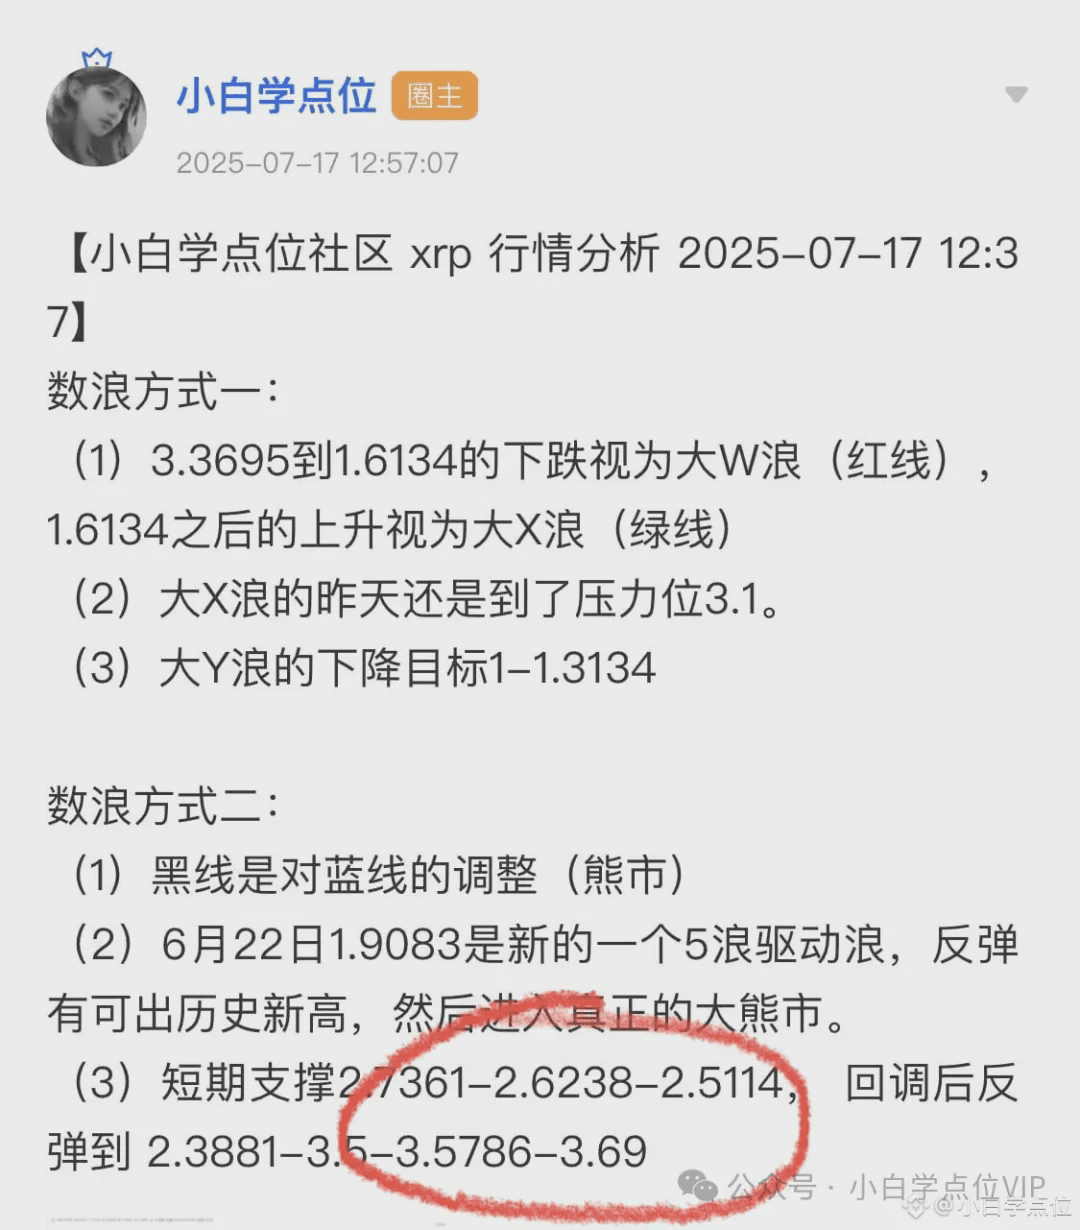
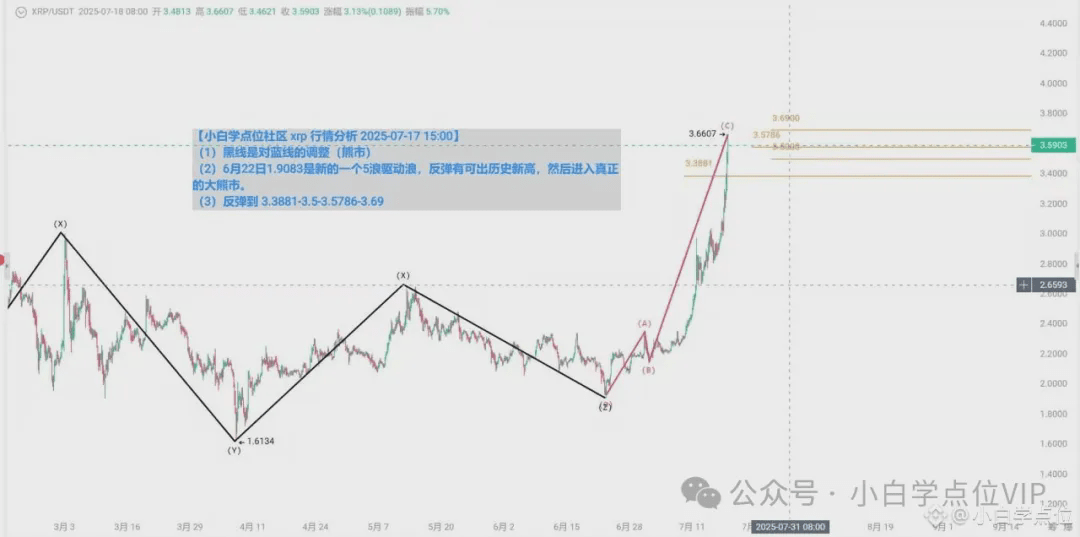
The latest chart is as follows:
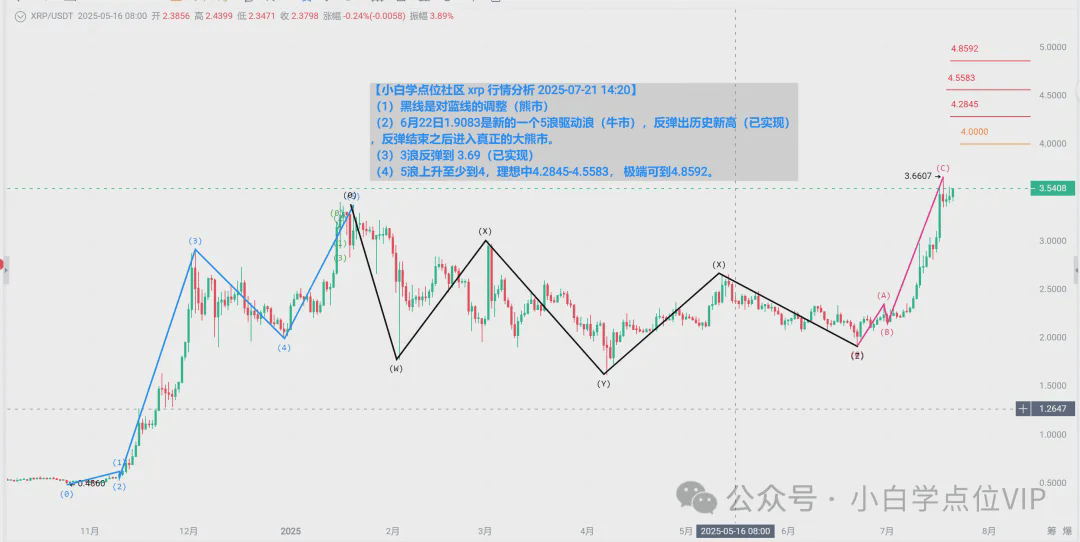
(1) The black line is an adjustment to the blue line (bear market)
(2) On June 22, 1.9083 is a new 5-wave driving wave (bull market), rising to a historical high (already achieved), and after the rise ends, it enters a true bear market.
(3) Wave 3 has risen to 3.69 (already achieved).
(4) The rise of wave 5 is at least to 4, ideally at 4.2845-4.5583, and could go as high as 4.8592 in extreme scenarios.
Eleven, SOL 200 is not a dream!
Last week, the private circle suggested that SOL would reach 200 or above, and this was also shared with the free group; many didn't believe it, but now they surely believe it!
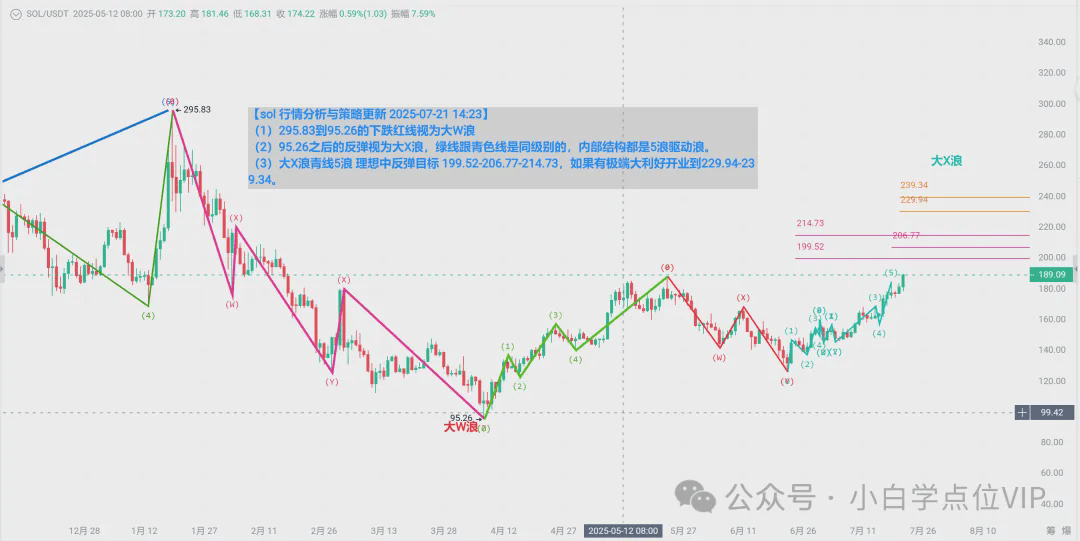
(1) The decline from 295.83 to 95.26 is considered a big W wave.
(2) The rise after 95.26 is regarded as a big X wave, with the green line and cyan line being of the same level, and the internal structure is driven by 5 waves.
(3) The Big X wave's green line 5 wave, ideally rising target 199.52-206.77-214.73, and if there is extreme good news, it could even reach 229.94-239.34.
Twelve, the A shares soar into the clouds three thousand feet
Humanoid robots have continuously received good news, with decent rises before the mid-term report, leading to various related chips and solid-state battery fish and shrimp rising to different degrees.
Anti-involution industries can be used as a defense.
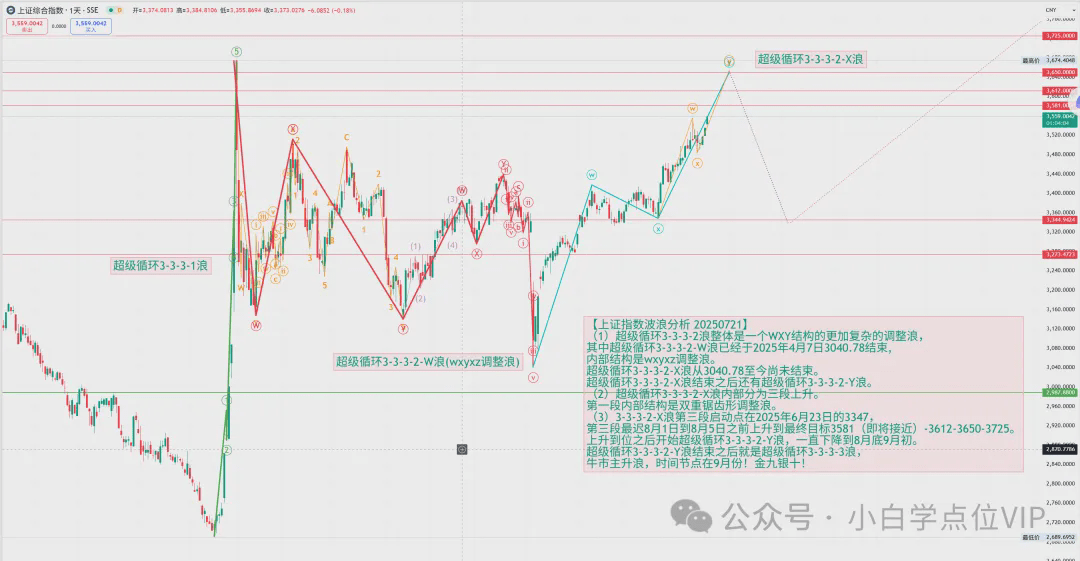
(1) The overall structure of the super cycle 3-3-3-2 is a more complex adjustment wave of the WXY structure.
The super cycle 3-3-3-2-W wave ended on April 7, 2025, at 3040.78.
The internal structure is an wxyxz adjustment wave.
The super cycle 3-3-3-2-X wave has not ended since 3040.78.
After the end of the super cycle 3-3-3-2-X wave, there is still the super cycle 3-3-3-2-Y wave.
(2) The super cycle 3-3-3-2-X wave is divided into three rising segments.
The internal structure of the first segment is a double zigzag adjustment wave.
(3) The starting point for the third segment of wave 3-3-3-2-X is at 3347 on June 23, 2025.
The third segment will rise to the final target of 3581 (approaching) - 3612 - 3650 - 3725 at the latest between August 1 and August 5.
After reaching the target, start the super cycle 3-3-3-2-Y wave, which will continue to decline until the end of August or early September.
After the end of the super cycle 3-3-3-2-Y wave, it will be the super cycle 3-3-3-3 wave.
The main rising wave of the bull market is in September! Golden September, Silver October!
Thirteen, CSI 2000 Trend
Market analysis is updated in real-time to a private circle.
Non-real-time market analysis is updated irregularly (at most once a month).
Fourteen, Dow Jones Trend
Market analysis is updated in real-time to a private circle.
Non-real-time market analysis is updated irregularly (at most once a month).
Fifteen, Tesla's Trend
Market analysis is updated in real-time to a private circle.
Non-real-time market analysis is updated irregularly (at most once a month).
Sixteen, major HK trends
Market analysis is updated in real-time to a private circle.
Non-real-time market analysis is updated irregularly (at most once a month).
Seventeen, all-tech wave trends
Market analysis is updated in real-time to a private circle.
Non-real-time market analysis is updated irregularly (at most once a month).
To forge steel, one must first be strong; only by improving cognition can one successfully traverse the bull and bear markets. We focus on sharing knowledge, cultivating independent thinking, learning and accumulating in bear markets, and allowing ourselves to become someone else's dream in bull markets. We welcome those who resonate with the values of the Xiao Bai Learning Points community, willing to learn and cultivate independent thinking; only when you transform this knowledge and skills into your own accumulation can you possess the ability for independent thinking and avoid becoming a pawn!
💡 Note: Investing is like walking in the dark; always carry the lantern of 'risk awareness' to avoid trading fog, and refuse to blindly chase the light.
If you have also floated in the sea of desire, like 👍 + follow 'Xiao Bai Learning Points,' leave a glimmer in the comments, and share it so more people can see - life is worth it, don't bet your life.
