Price Check: TIA just broke above the $2.20 mark, climbing over 10% in the last 24h 📈
Volume Surge: A massive uptick in volume—$18M+ traded—confirms strong buying pressure
Technical Signals: Short-term oscillators signal "Buy", though weekly/monthly metrics still lean Sell, hinting at a momentum pickup
---
📊 Chart Breakdown & Trend Analysis
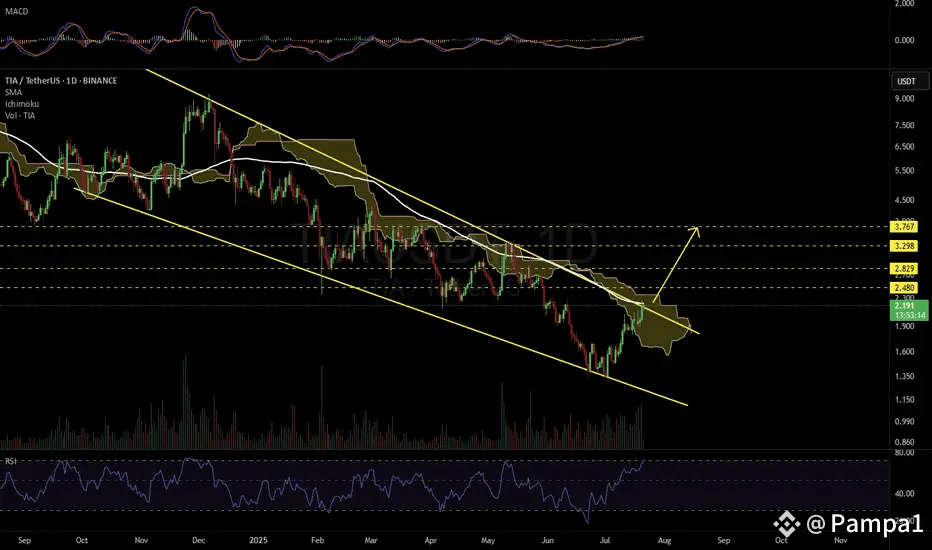
Key Levels Cleared: TIA surged past $1.96–$2.09, confirming bullish breakouts with strong bullish engulfing candles
Moving Averages:
Daily MA20 & MA50 – crossed decisively (now ~$2.00+)
MA200 – breached upward (~$1.66), signaling a potential trend reversal
Momentum Indicators:
MACD showing strong bullish divergence + expanding histogram
RSI is in overbought territory (~70) — healthy bullish but may hint at a short pullback
Volatility: Bollinger Bands are widening—expect some whip action on the way up
---
🎯 Trade Strategy & Zones
✅ Entry Zone: $2.10–$2.20 – optimal for momentum trades
🎯 Profit Targets:
TP1: $2.50 (short-term resistance)
TP2: $3.20 (previous accumulation zone)
TP3: $4.50 (psychological level & prior breakdown area)
🛑 Stop-Loss: $1.95 – just under MA50 to manage downside risk
💡 Tips:
Scale in: start small, then add into green continuation candles (e.g. bullish engulfing)
Consider partial profit-taking at TP1, then let the rest ride
Watch RSI: if it dips below 60, brace for healthy retracement before next leg
---
📌 Why This Setup Matters
1. Trend Reversal in Play: Daily MA200 breakout + rising MA20/50 indicates upside momentum
2. Real Volume Behind Move: Not just noise—actual capital is flowing in 📊
3. Bullish Candles Confirm: Strong engulfing patterns at support show buyer conviction
4. Healthy Volatility: Wide Bollinger Bands suggest room for upward swings—and caution for quick corrections
---
💼 Risk Management & Execution
Position Size Wisely: Volatility can bite—don’t overexpose
Tight SL: Hitting ~$1.95 invalidates the setup
Adapt to Pullbacks: On dip back near $2.00–2.05, strengthen your entry or adjust SL accordingly
Stick to Targets: Stay disciplined—lock in partial profits and protect gains
---
🧠 Final Take
TIA might be shaking off its past with renewed bullish energy 🚀. With the technicals aligning—MA breaks, volume, momentum—the path to $2.50+ looks tangible. But remember: overbought RSI could trigger a temp pullback, so stay sharp. Trade smart, manage your risk, and ride the waves—even if doesn’t hit TP3 overnight.
---
🔁 Your Turn, Square Fam!
Are you stacking near $2.10 or waiting for the next green candle?
Which target feels most achievable: $2.50, $3.20—or are you bold enough for $4.50?
Jump into the comments—let’s grow together! 🤝
---