🔍 What’s the Buzz? Overview of SOL’s Technical Setup
Solana is flashing multiple bullish patterns simultaneously—🔥 a symmetrical triangle breakout, a bullish flag, and a golden cross with Fibonacci alignment. This “technical convergence” suggests strong upward momentum if key levels hold .
---
📈 Pattern Play-by-Play
1. **Triangle Breakout (~$164)**
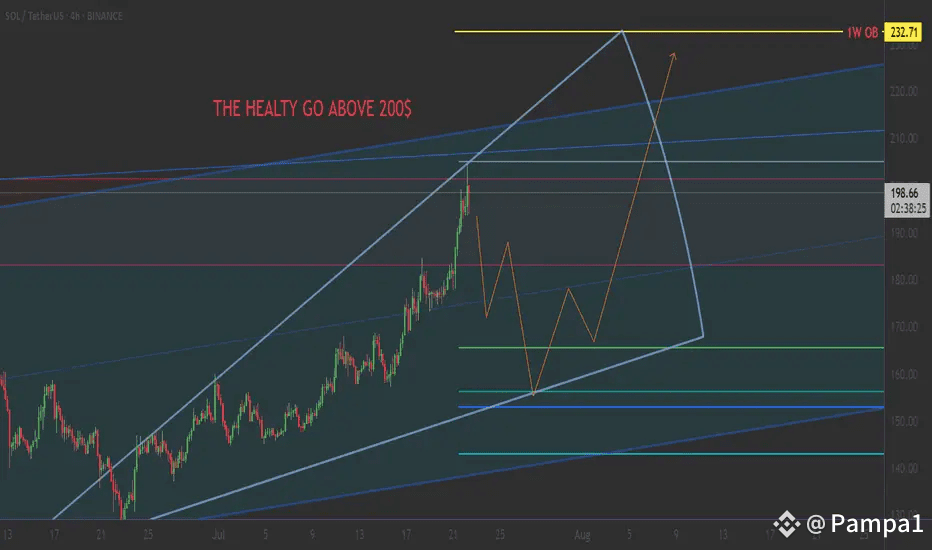
SOL just surged above a symmetrical triangle’s upper boundary—a classic continuation pattern—with an initial Fibonacci target near $164 .
2. **Bullish Flag on Daily Chart ($155–165)**
A flag base formed between ~$155–165, recently broken on strong volume. This supports a measured move potentially reaching $280–300, according to multiple analysts .
3. Golden Cross & Fib Collab
The 50-day EMA is crossing above the 200-day EMA (“golden cross”), a key long-term bullish signal. Combine that with Fib from ~$120 swing low to $167 high, and the 1.618 extension aligns perfectly at $196.5–200 .
---
🌐 On‑Chain & Sentiment Boosts
ETF Frenzy: Probability of a Solana spot ETF approval is pegged at ~90–91%, which frequently serves as a strong catalyst .
Network Activity: SOL wallets holding small balances are growing, with millions of unique addresses formed — a sign of organic network strength .
---
🎯 Key Levels & Trade Triggers
Level Significance
Support: $155–165 Flag base; entry zone on pullbacks
Triangle breakout ~$167 Confirms momentum; initial target ~$180
Fib target ~$196–200 Golden cross + Fib alignment
Bullish extension: $280–300 Flag measured move if momentum holds
---
⚠️ Swing Scenarios & Risk Management
🎯 Bull case: Clean breakout above $167 on volume → target $196–200; next leg possible to $280–300.
🔄 Range case: If price stalls under resistance, consolidation in the $167–180 zone is likely.
⚠️ Bear warning: Breaking down below $155 invalidates the bullish flag—watch for reversal risk.
Risk tip: Use properly sized entries, set stop-loss below $155, and consider partial profit-taking near $200 while letting the rest ride.
---
💡 Square‑Style Trading Tips
📌 Share your SOL chart tagging triangle, flag, Fib, golden cross—help others visualize!
🎤 Ask creators: What do verified analysts think about on-chain ETF probability?
🧠 Use risk framing: Entries, stop-loss, target zones—trade with structure, not hype.
🤝 Stay transparent & respectful: Cite your patterns and data—no pump talk, but positive help is welcome!
---
🎁 Final Takeaway
SOL’s technical convergence—triangle breakout, flag, golden cross, and Fib alignment—sets the stage for a compelling rally from $167 to ~$200, with a potential extended run toward $280–300 if momentum holds. ETF buzz and growing network activity add fuel to the fire. Track price reactions, volume validation, and on-chain momentum, and share your setups with the Square Family!
---
Community-driven educational content only—not financial advice. Always DYOR and trade responsibly! 💙
---