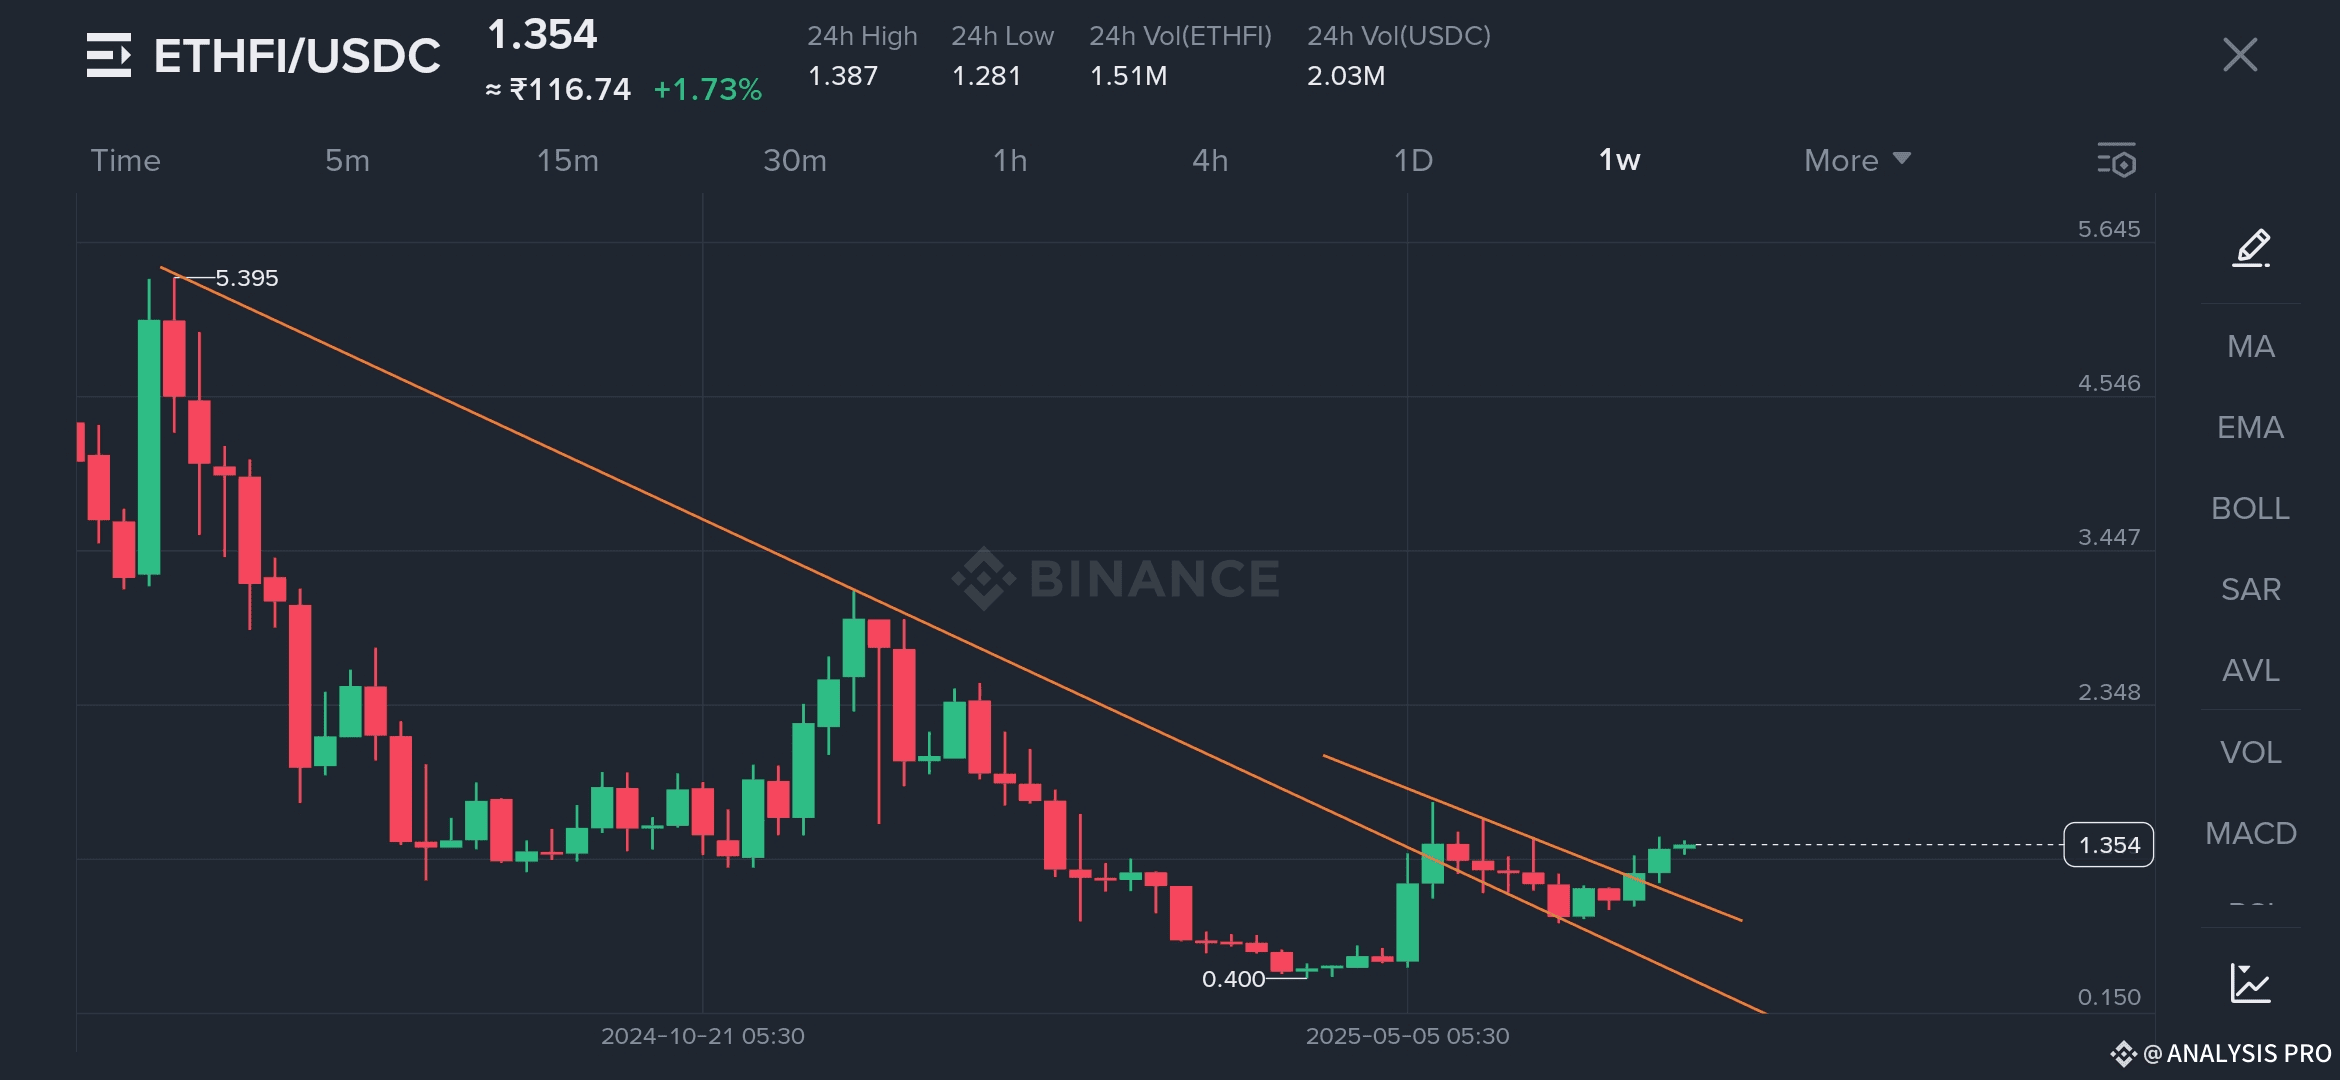
Current Price: $1.354
24h Change: +1.73%
24h High / Low: $1.387 / $1.281
Volume (ETHFI): 1.51M
Volume (USDC): 2.03M
Chart Interval: 1 Week (1W)
Exchange: Binance
Chart Analysis
📉 Downtrend Breakdown
ETHFI traded in a sharp downtrend from October 2024 through May 2025, forming a classic descending channel.
The bottom was established at $0.400, followed by consolidation and a decisive breakout through the upper trendline.
The breakout was accompanied by strong bullish weekly candles, signaling potential buyer dominance.
📈 Current Price Action
ETHFI is trading above the channel resistance at $1.35, indicating the start of a possible bullish trend.
The recent higher lows and higher highs confirm a trend structure reversal.
Volatility remains moderate, providing room for healthy price discovery without excessive risk.
Key Levels to Watch
Price Level Type Significance
$0.400 Major Support Cycle bottom; historical low
$1.35 Breakout Level Above downtrend channel
$2.34 – $2.34 Resistance Zone Prior consolidation zone
$3.44 Mid-Term Target Horizontal resistance area
$4.54 – $5.39 Long-Term Resistance Key levels from peak decline
Fundamentals Driving Interest
Staking & Restaking Narrative: EtherFi plays a major role in the Ethereum liquid restaking narrative, leveraging EigenLayer and LSD (Liquid Staking Derivatives).
Strong Community & DeFi Ties: The project is supported by high-profile Ethereum supporters and is being integrated into broader DeFi protocols.
Increased Trading Volume: Rising daily and weekly volumes suggest returning interest from traders and investors.
Technical Indicators
Momentum: Bullish after breaking the descending channel.
Volume: Increasing steadily — a positive sign of confirmation.
Weekly RSI (not shown but implied): Likely rising from oversold territory, indicating strengthening buying pressure.
Price Forecast
Short-Term (1–4 weeks):
A move toward $2.34 is likely if ETHFI can sustain support above $1.30–$1.35.
Retesting the breakout zone would be healthy and provide long entry opportunities.
Medium-Term (1–3 months):
If the macro environment remains favorable (ETH price stable or rising), ETHFI could test the $3.44–$4.54 resistance area.
Breaking $5.00 would open the door for price discovery and new highs.
Risks to Monitor
Market Sentiment Shift: ETHFI’s performance is tied closely to ETH’s price and restaking hype.
Volume Drop-Off: A significant decline in volume without further upside could make the breakout unsustainable.
False Breakout Risk: If ETHFI falls back below $1.20, it would invalidate the bullish structure.
Conclusion
ETHFI appears to be breaking free from a multi-month downtrend, fueled by strengthening technicals and renewed interest in the Ethereum staking ecosystem. The breakout above the descending channel signals a shift in sentiment, with price targets in the $2.30–$3.40 range now back in play.
Investors should watch for continued volume growth and price stability above $1.30 to confirm the breakout's strength.