The upward momentum of WIF not only exceeds the 200-day exponential moving average (EMA) but is also approaching the key resistance level at $1.21. Signals from technical analysis and the derivatives market reinforce the strong bullish trend as market momentum continues to grow, and open interest (OI) surges to nearly $600 million – the highest since the beginning of the year.
The open interest of Dogwifhat has surged, reflecting increasing optimism.
According to data from Coinglass, the open interest (OI) of WIF has surged to a record high for the year, reaching $572.11 million — a significant increase from the $482.89 million recorded on Sunday. Typically, a sudden spike in OI is seen as a clear indicator of increasing bullish sentiment, showing that capital is flowing strongly into the derivatives market.
In addition, the funding rate is currently at 0.0182%, reflecting a trend leaning towards the bulls as trading activity becomes more vigorous. Buyers are willing to pay a positive funding fee to maintain the balance between spot and swap prices, while also offsetting the imbalance caused by strong buying pressure in the derivatives market.
Dogwifhat is approaching a crucial resistance level, with bulls targeting $1.67.
Last week, WIF regained the important psychological threshold of $1 and surged 12% from the 200-day exponential moving average (EMA) at $1.06. However, the upward momentum is facing significant resistance at the $1.21 zone – coinciding with the 50% Fibonacci level, measured from the peak of $4.83 on November 13 to the bottom of $0.30 on April 9.
If WIF can close firmly above this level, it will be the highest closing since January 26, opening the possibility of conquering the next resistance at the 61.8% Fibonacci level – equivalent to $1.67.
For investors still on the sidelines, positive signals are coming from the 50-day EMA crossing above the 100-day EMA — an indicator showing that the short-term trend is overshadowing the medium-term trend. This also increases the likelihood of forming a golden cross as the 50-day EMA approaches crossing above the 200-day EMA.
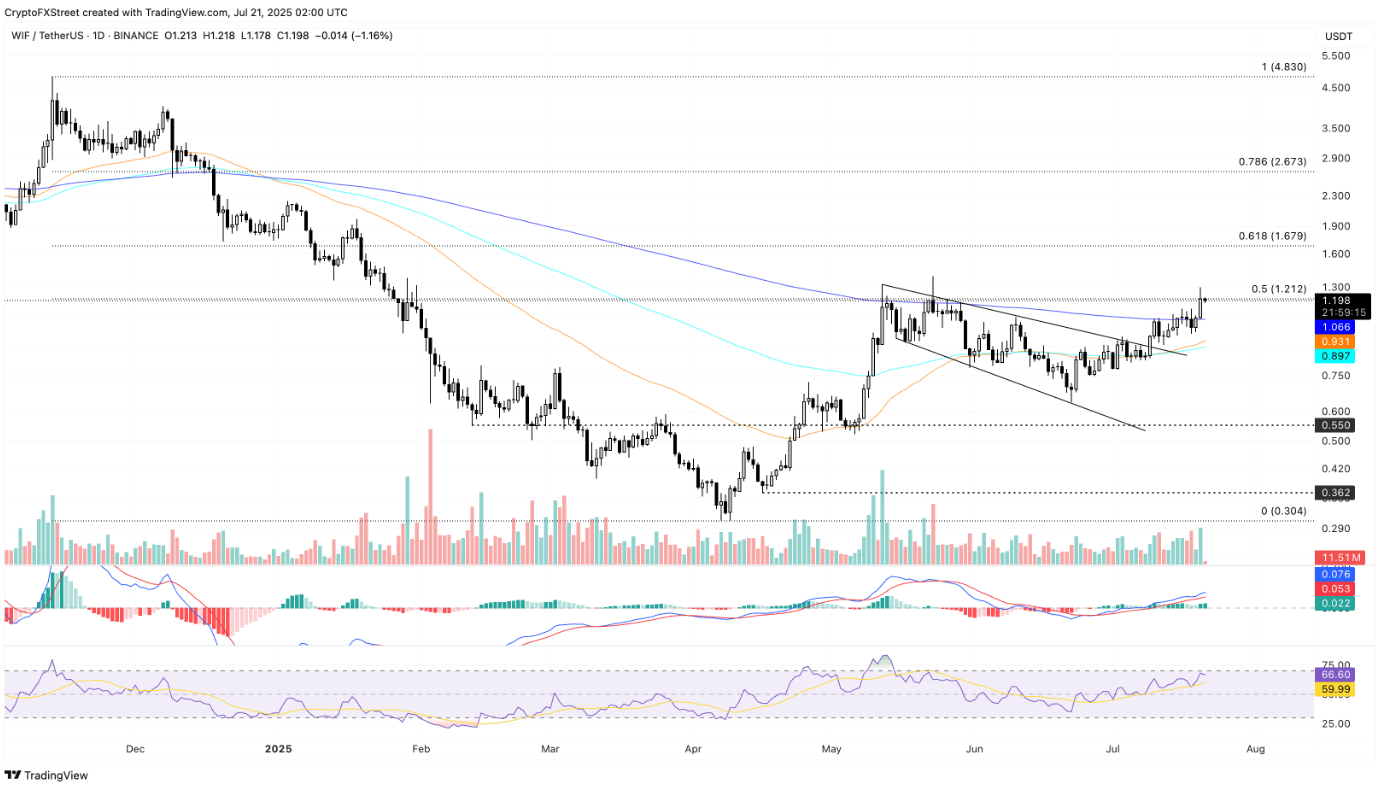
At the same time, the MACD line and the signal line of the MACD indicator continue to move above the zero line, reflecting that bullish momentum is still maintained. The increase in green histogram bars further strengthens confidence in the positive trend.
Meanwhile, the relative strength index (RSI) on the daily chart has reached 66 – approaching the overbought zone, indicating that demand is increasingly dominant.
However, if the price fails to break through the $1.21 mark and turns downward, this will be another failure of the bullish trend, possibly pulling WIF back to test the 200-day EMA at $1.06.
