Story Highlights
Fueled by ETFs, whales, and Peter Thiel, Ethereum has soared 56% this month. Is the next breakout point $6,700?
Cryptocurrency analysts have identified a bullish wedge pattern for ETH. The price may first touch $4,100, and if the breakout is confirmed, the target price will be $6,700.
Ethereum currently looks bullish. Over the past seven days, it has surged by 24.1%, outperforming its main competitors Bitcoin (-1.9%), Ripple (19.7%), Binance Coin (9.3%), Solana (11.6%), and Cardano (14.3%). In just the past 24 hours, it has skyrocketed by at least 3.1%.
In a sensational article on X, a cryptocurrency analyst known as the 'Titan of Crypto' stated that Ethereum may soon experience a significant breakthrough.
Ethereum Market Overview
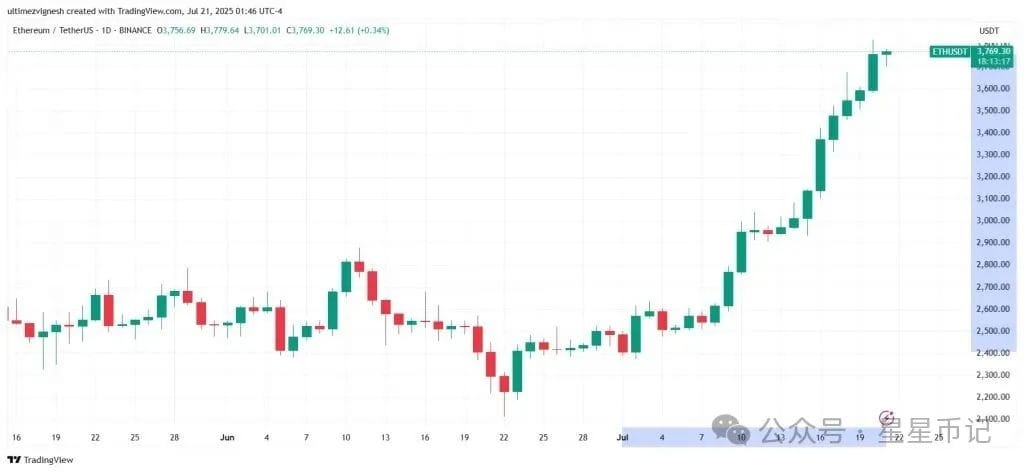
In the past 30 days, Ethereum has shown strong upward momentum. At the beginning of this month, Ethereum was priced at $2,406.19. Since then, the price has risen by over 56.29% to $3,758.73.
The latest bullish rebound is primarily driven by a substantial inflow of institutional funds into the spot ETH ETF, increased whale activity, and positive sentiment from major investors like Peter Thiel.
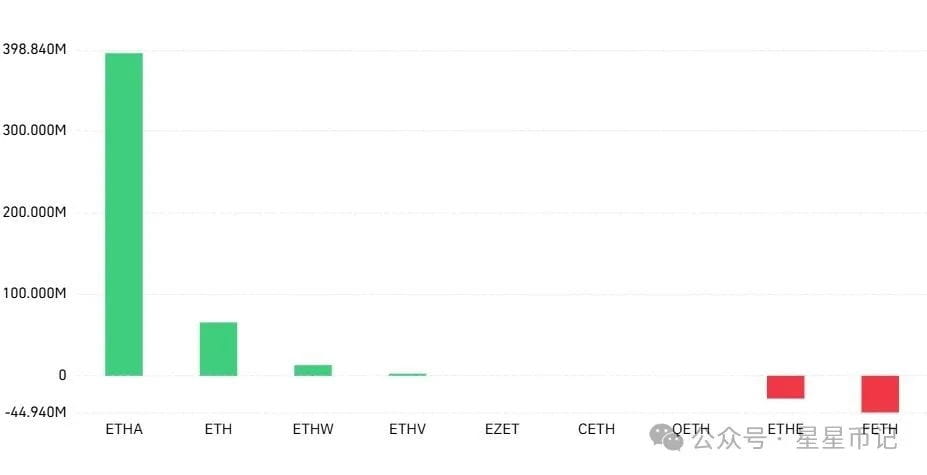
Between July 14 and 18 alone, up to 2.1824 billion ETH flowed into the Ethereum spot ETF market. On July 16, 726.6 million ETH flowed in, the highest single-day inflow of the previous week. On the last day of that week, at least 402.5 million ETH entered the market. Of these, at least 394.9 million ETH flowed in through BlackRock's ETHA.
Recently, a document from the U.S. Securities and Exchange Commission (SEC) revealed that former PayPal CEO Peter Thiel quietly acquired a 9.1% stake in BitMine Immersion Technologies, a company aiming to become the Ethereum version of MicroStrategy.
The gas limit on Layer 1 of the Ethereum network has also increased, enhancing transaction capacity, and liquid staking continues to grow, with Binance-staked ETH accounting for 20% of the market.
Is Ethereum preparing for a major bull market?
Famous cryptocurrency analyst Titan of Crypto indicated that Ethereum is following a technical chart pattern known as a right-angled descending expanding wedge on the weekly chart.
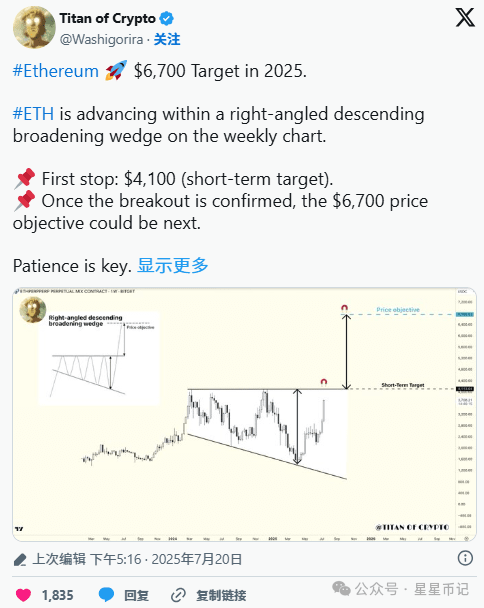
The right-angled descending expanding wedge is a bullish formation. It is characterized by a horizontal resistance line and a descending support line, indicating increasing volatility and market indecision. It suggests a potential upward trend after a breakout above the resistance level.
The chart shared by Titan of Crypto in his X post shows that the Ethereum market entered this pattern in early 2024.
He emphasized the chart's perspective, suggesting that the market may first reach the $4,100 level resistance line. He also predicted that if the breakout is confirmed, the next major target price would be $6,700—calculated by adding the height of the triangle at the breakout point.
In summary, patience is advised as the price trend of ETH may take time to manifest.


