After setting a record high of $123,218 last week, Bitcoin (BTC) is currently in a lull, trading in a narrow accumulation range as the market awaits a clear signal for the next move. Meanwhile, Ethereum (ETH) and Ripple (XRP) stand out with signs of recovery, as both coins maintain important support levels, raising hopes for a new price increase.
Bitcoin is consolidating after setting a new ATH
After setting a new ATH of $123,218 at the beginning of the week, Bitcoin (BTC) is currently fluctuating in a narrow range from $116,000 to $120,000. As of the time of writing on Monday afternoon, BTC is trading around $117,800, slightly above the nearest support zone.
If the bears succeed in pulling the price below the $116,000 support level on the daily chart, the downward adjustment could continue to expand towards the 50-day EMA at $110,297 — an important technical support level.
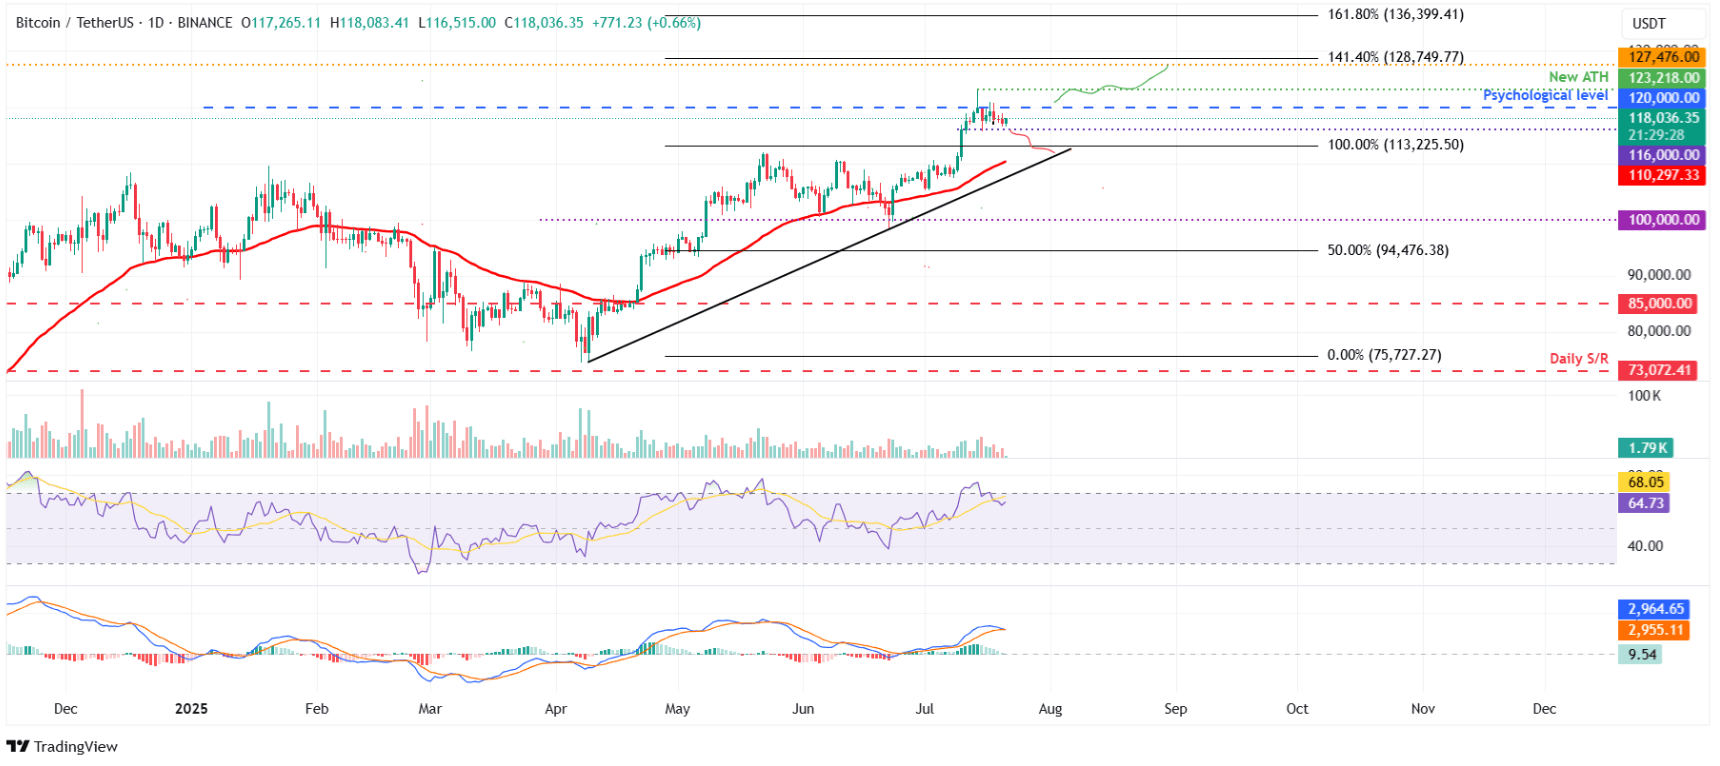
The Relative Strength Index (RSI) is currently at 64, having retreated from the overbought area (above 70) recorded last week. This indicates that the upward momentum is gradually weakening. At the same time, the MACD indicator on the daily chart is approaching the formation of a bearish cross, signaling the risk of a sell signal forming and the potential for the downward trend to dominate again.
However, if BTC can close firmly above the resistance level of $120,000, the recovery momentum may be reactivated, bringing the price close to or even surpassing the historic peak of $123,218 — opening up prospects for conquering new highs.
Ethereum: The bulls are aiming for the $4,000 mark
Ethereum (ETH) recorded a strong increase of 26.40% in the past week, closing the Sunday session at the important resistance level of $3,730. As of Monday afternoon, this coin is trading around $3,739 – a signal that the upward trend is still being maintained.
If the $3,730 level continues to act as a solid support area, ETH could very well aim for the next target at the important psychological level of $4,000.
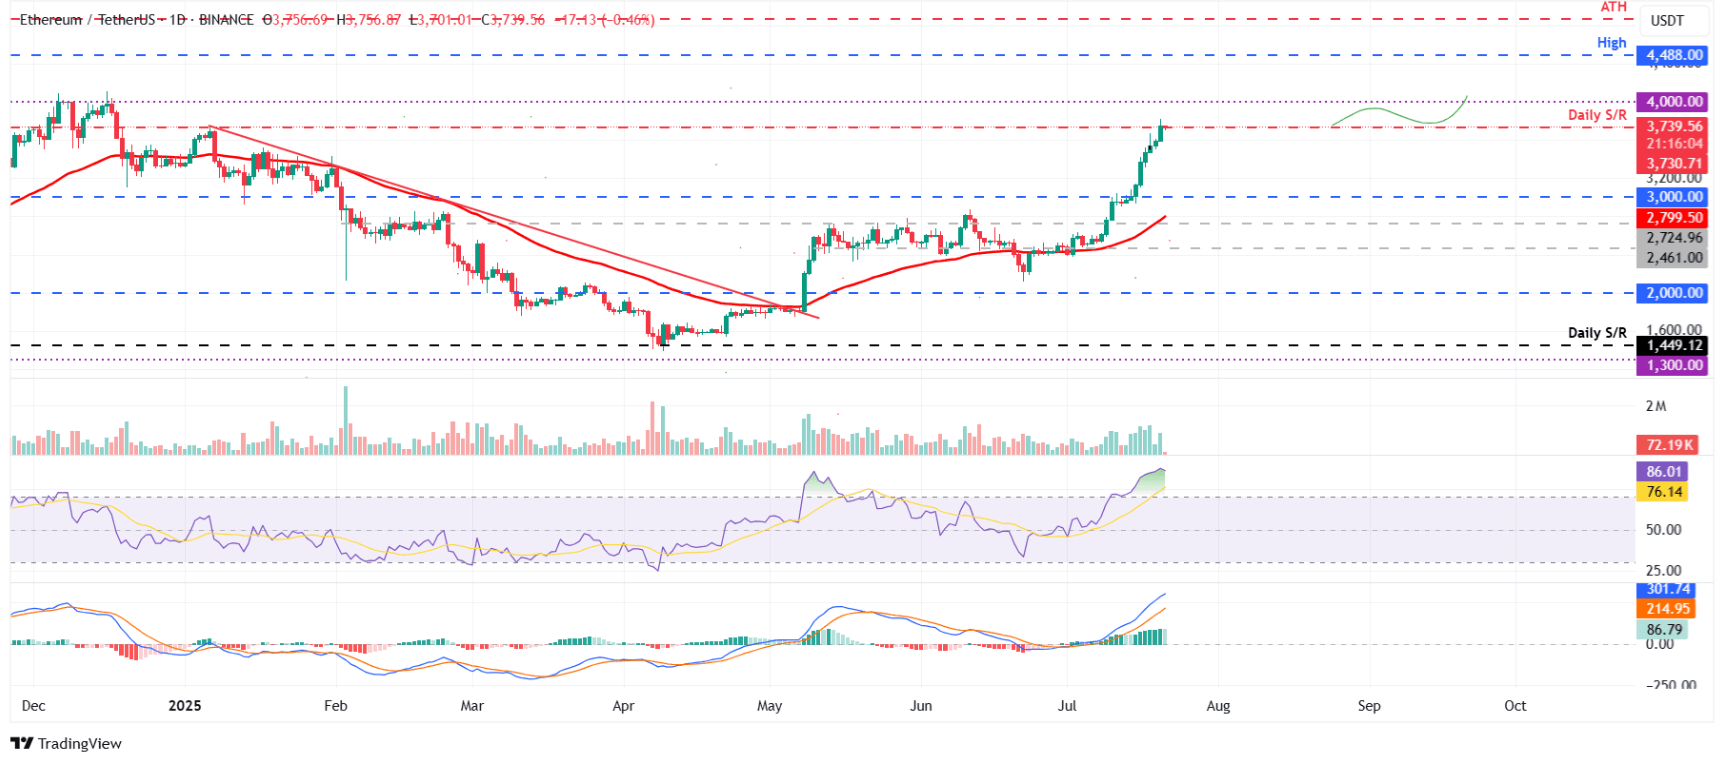
Technical indicators are also supporting the upward trend. The RSI index on the daily chart is currently at 86 — well above the overbought threshold of 70 — reflecting very strong upward momentum. In addition, the MACD indicator has created a bullish crossover since early July and continues to maintain a positive signal. The green histogram bars are increasingly high and above the neutral line, indicating a significant increase in buying pressure.
Nevertheless, the possibility of a correction cannot be ruled out. If profit-taking pressure appears, the price of ETH may return to test the important support area around $3,000.
XRP found support around the $3.40 level
XRP has surged strongly in the past week, recording an increase of over 20% and setting a new historical peak at $3.66 on Friday. As of the time of writing on Monday, this coin still retains its momentum, trading around $3.47 after finding solid support at $3.40 throughout the weekend.
If the upward momentum continues, XRP may challenge the $3.66 peak again. A solid daily candle close above this level will signal the possibility of extending the upward trend to the next resistance area at $4.13 — the 141.40% Fibonacci extension level, measured from the January peak at $3.40 to the April bottom at $1.61.
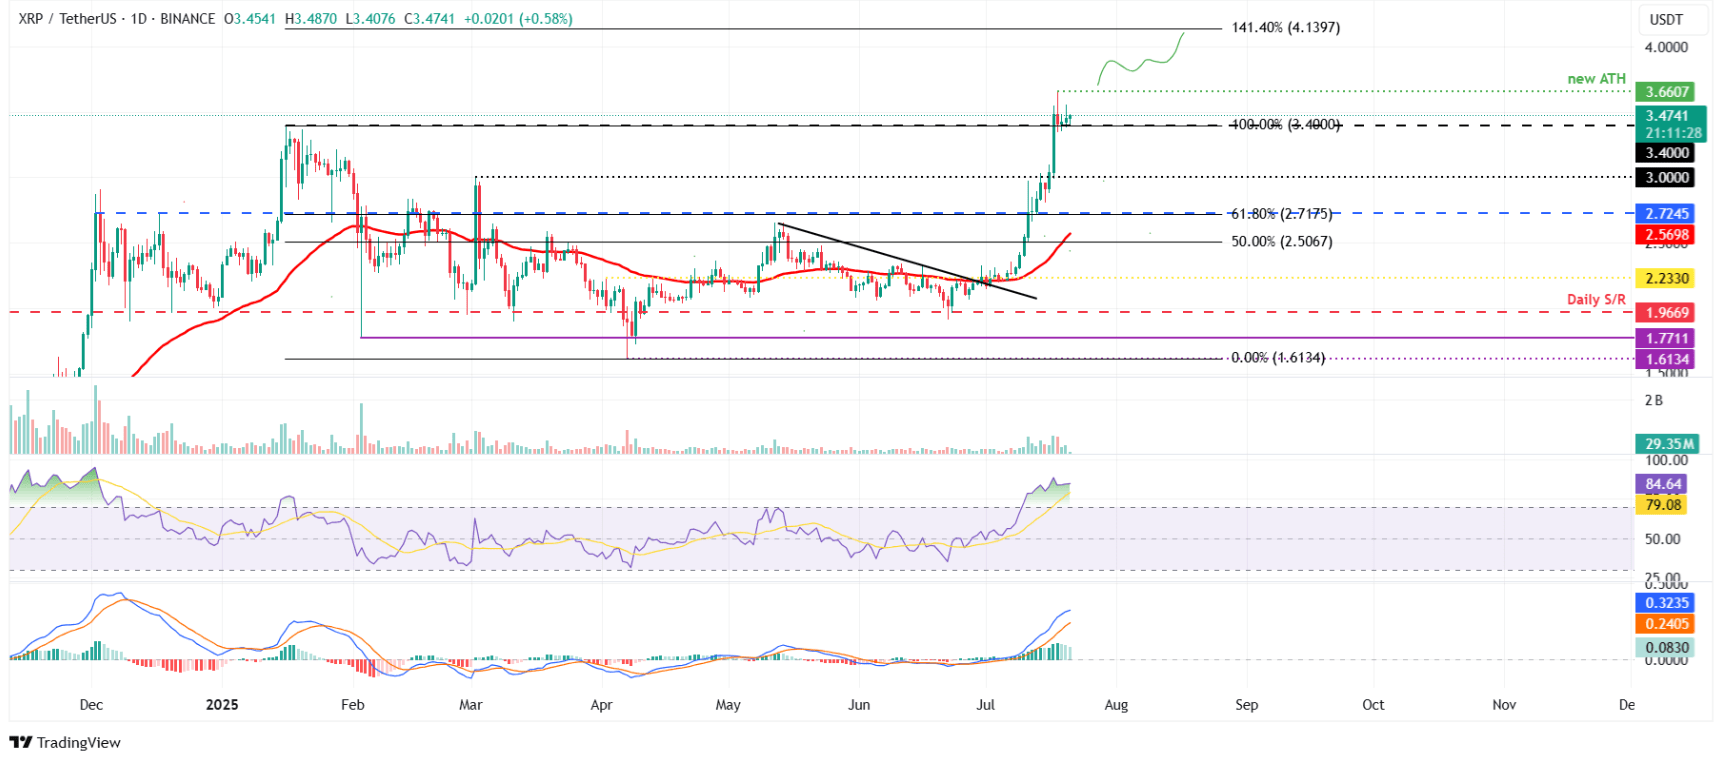
However, the RSI on the daily chart is touching 84, reflecting a clear overbought condition — a factor that investors should pay special attention to. However, similar to Ethereum's behavior, the MACD still shows positive signals, reinforcing hopes for continued price increases in the short term.
On the contrary, if the market adjusts, the support area around the $3.40 mark will be the first point to watch, where the downward momentum may temporarily pause before determining the next trend.
