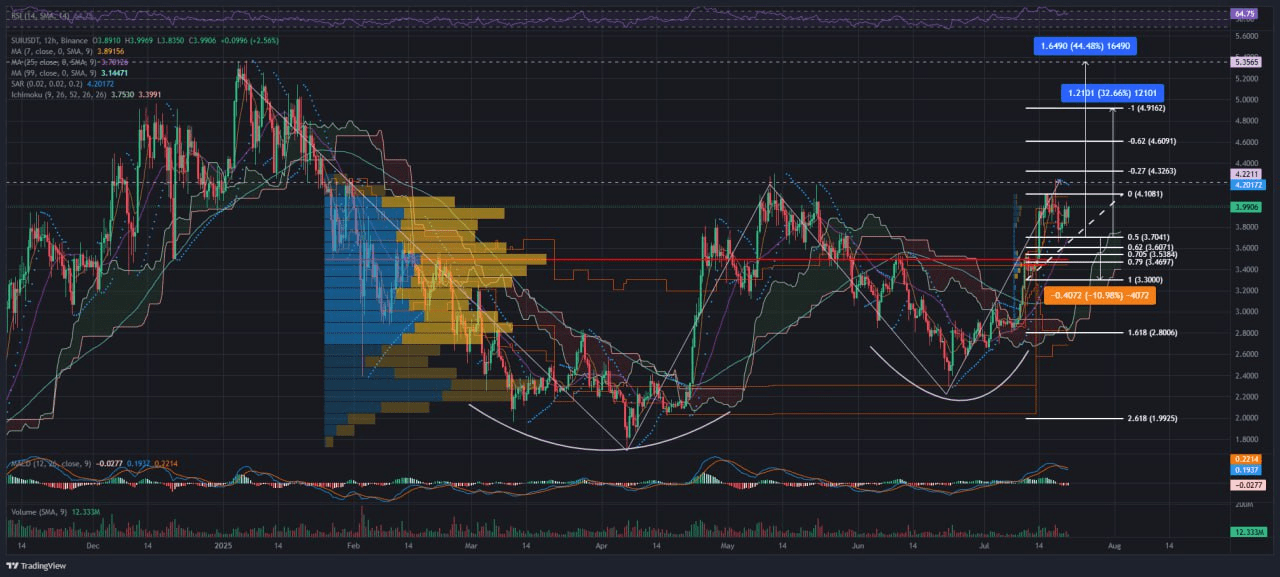
$SUI 📊 Detailed technical analysis #SUI/USDT (1D TF)
Current price: $3.9906
📍 1. Global picture
A large bullish pattern "double bottom" is clearly forming on the daily chart, with the neckline around $4.22. This is a classic reversal formation after a downtrend. In the event of a breakout of the neckline, the target for the pattern is $5.35, which corresponds to a +34% increase from the current price.
🎯 Scenarios for future developments
✅ Long scenario (main):
Entry condition: Breakout and consolidation above the level of $4.22 (neckline)
Targets:
TP1: $4.61 (Fibo -0.62)
TP2: $4.91 (Fibo -1.0)
TP3: $5.35 (target for double bottom, Fibo -1.618)
Stop Loss: below the zone of $3.70–3.60 (level 0.5–0.618 Fibo and MA25)
Probability of execution: 65–70%, if momentum is maintained and breakout above $4.22
❌ Short scenario (alternative, upon bounce):
Entry condition: Bounce from $4.22 without a breakout and a pullback below $3.90
Targets:
TP1: $3.70 (0.5 Fibo)
TP2: $3.49 (0.786 Fibo)
TP3: $3.30
Stop Loss: above $4.25
Probability of execution: 30–35%, if volumes weaken and the price does not hold resistance
🧭 Key levels
Resistance: $4.08 / $4.22 / $4.61 / $4.91 / $5.35
Support: $3.83 / $3.70 / $3.60 / $3.49 / $3.30
⚠️ Conclusion and strategy
The formation "double bottom" is ready to be executed, but the key trigger is a confident breakout above $4.22 on volume. All technical indicators confirm a bullish sentiment, and from a risk/reward perspective, the long position is attractive (especially when entering in the zone of $3.95–$4.05 with a short stop loss below $3.70). $SUI