Solana $SOL surges 10.9% weekly testing $179 resistance as cup and handle pattern targets $295 breakout with TVL growing to $ 9B.
Solana has delivered an impressive 10.9% surge this week, riding the broader cryptocurrency rally to test critical resistance levels around $179.
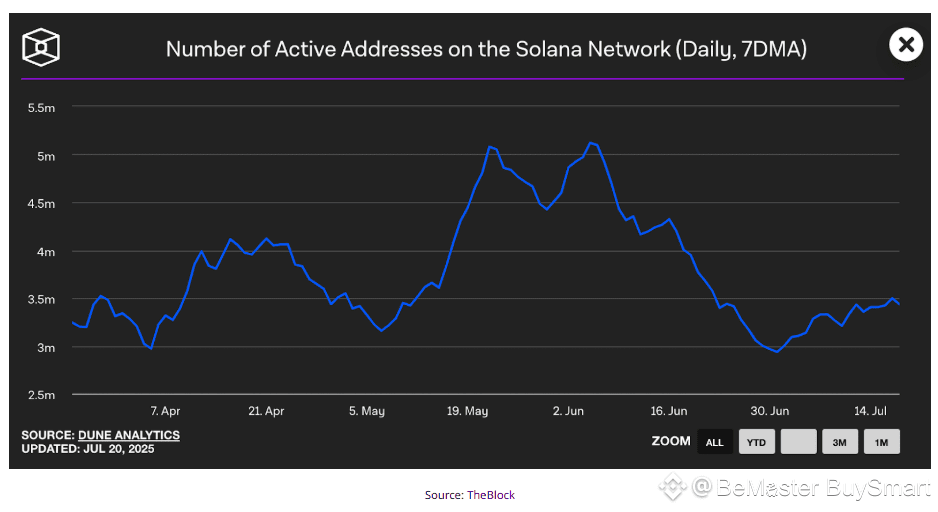
The rally coincides with strengthening on-chain fundamentals, including a growth in Total Value Locked (TVL) from $6 billion to over $9 billion and the number of returning active wallets surpassing 3.3 million users.
Technical analysis reveals SOL is engaged in a critical battle between discount and premium zones, currently testing equilibrium around $179.
The cryptocurrency has been consolidating within a $145-$175 range, but recent price action suggests this consolidation may be nearing upward resolution.
Changes in character signals during March-April indicated a potential trend reversal, followed by Break of Structure confirmations, validating demand at lower levels.
Long-term analysis reveals an extraordinary cup and handle formation spanning multiple years, positioning SOL for a potential breakout toward all-time highs of $295.
Market Structure Tests $189 Breakout Zone
Solana’s 4-hour chart shows SOL testing the upper boundary of its equilibrium zone with key resistance at $189 representing the critical breakout level.
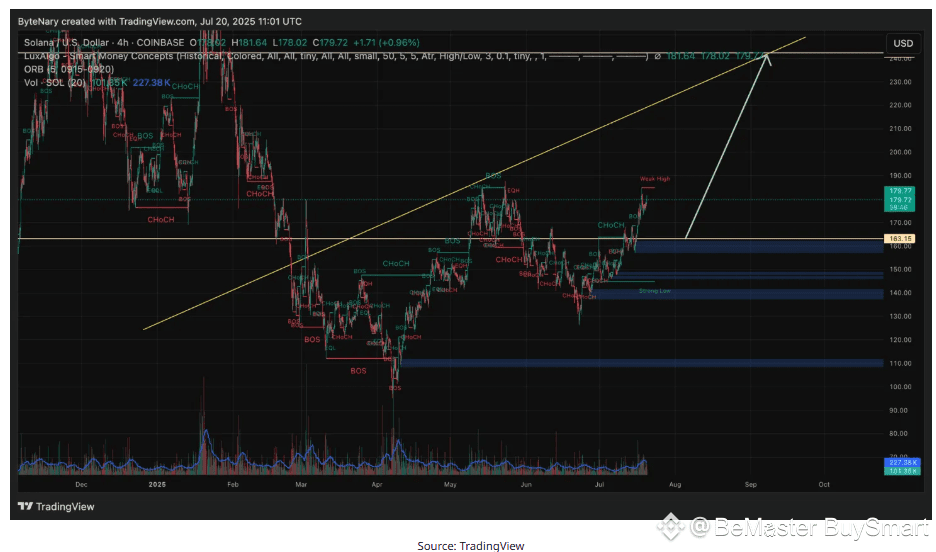
Volume profile analysis suggests a strong support foundation, as evidenced by high-volume nodes around $ 145.
Thinner trading above current levels typically leads to accelerated moves once resistance is cleared.
Federal Reserve pause and market expectations for 30-50 basis points of cuts by Q4 2025 create a favorable liquidity environment for high-beta assets like SOL.
Immediate targets following $189 breakout include $235 and $263 resistance levels, with analyst projections extending to $295, $360, and $402.
Solana-specific catalysts, including strong developer metrics and institutional partnerships, provide fundamental support for technical breakouts toward these higher targets.
Weekly Cup and Handle Points to $295 Target
Solana’s weekly chart reveals a massive cup and handle formation that has been developing over multiple years, representing one of the most bullish continuation patterns in technical analysis.
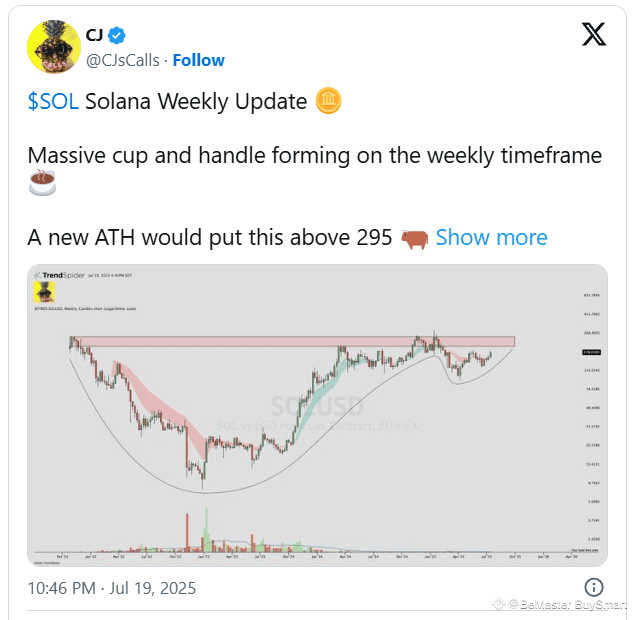
The cup formation shows SOL’s rally to $260 highs, followed by rounded bottom support in $80-120 range, and recovery creating a classic accumulation structure.
Currently, SOL appears to be forming the handle portion through a shallow pullback from the cup’s rim.
This final consolidation phase typically precedes explosive breakouts that complete the pattern.
The measured move projection targets $295 for new all-time highs, calculated by taking the cup’s depth and projecting upward from the breakout level.
Moreover, global liquidity improvements, driven by coordinated central bank easing, support the “second leg of liquidity wave,” benefiting cryptocurrencies.
Regulatory clarity developments, such as the GENIUS Act, provide additional tailwinds for altcoin allocation strategies as SOL approaches the completion of its pattern.
FOLLOW BE_MASTER BUY_SMART 💰💰💰 Appreciate the work. 😍 Thank You. 👍 FOLLOW BeMaster BuySmart 🚀 TO FIND OUT MORE $$$$$ 🤩 BE MASTER BUY SMART 💰🤩
