Helium (HNT) has surged strongly by 10% in the past 24 hours, leading the cryptocurrency market during this period. However, behind this impressive recovery are potential warnings: funds are quietly withdrawing from exchanges and technical indicators are signaling negatively, suggesting that the current uptrend may not be sustainable.
According to analysis from Bitcoin Magazine, although HNT is still maintaining a green color on the price chart, the weakening market structure along with dwindling liquidity could pave the way for a significant correction in the near future. Below are key factors that investors need to monitor closely.
HNT faces an important resistance level.
On the daily chart, the price of HNT is approaching an important supply zone, ranging from $3.90 to $4.24 — an area that has often become a 'pressure point' causing the price to plummet sharply.
History shows that this resistance level is not easy to overcome. On February 23, when HNT reached this price zone, the coin lost up to 42% of its value. By April 13, another approach caused the price to fall an additional 17% in just three days. Most recently, on May 28, HNT again plunged 46% after retesting this zone.
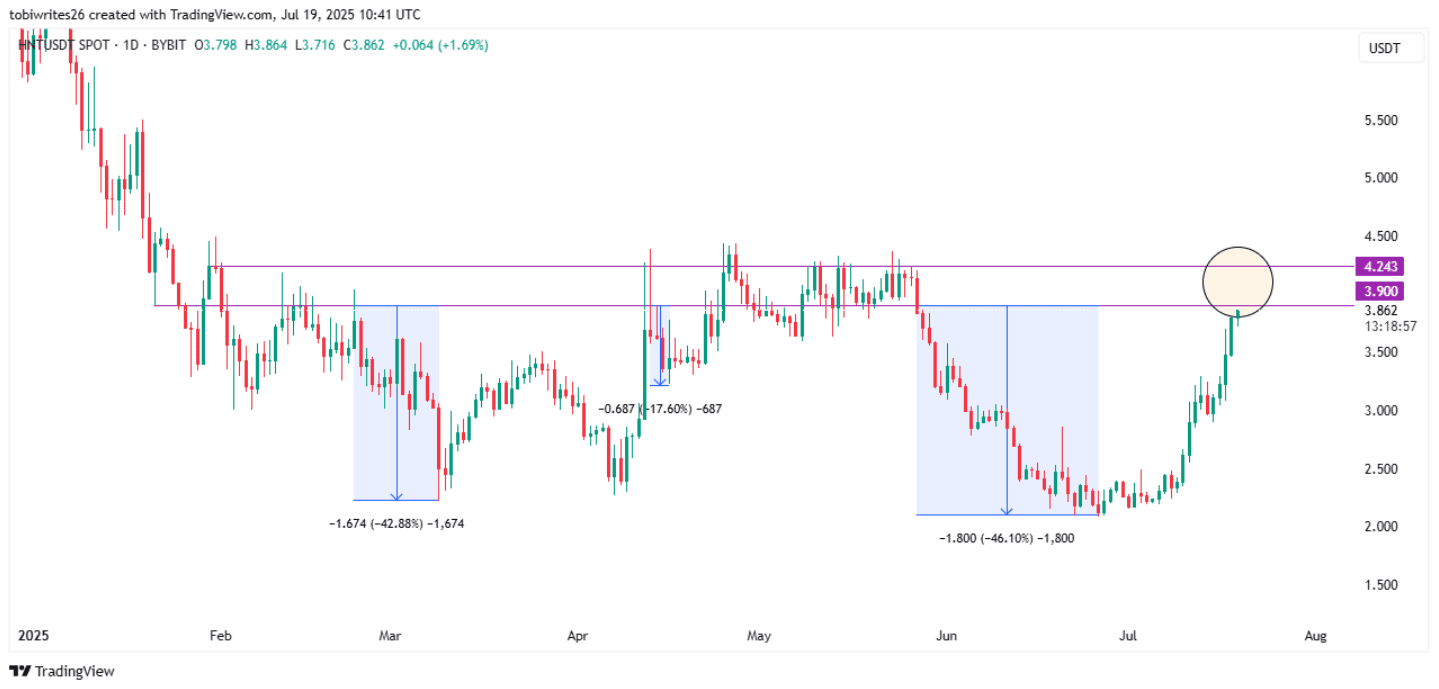
The repeated adjustment model shows that if HNT cannot break through the upper resistance zone, a new decline is likely to occur — with a range of fluctuation from 17% to 46%, and an average decrease of about 35%.
Investors are starting to reduce exposure to HNT.
Some investors seem to be actively narrowing their positions, indicating expectations of a potential price correction that may be imminent.
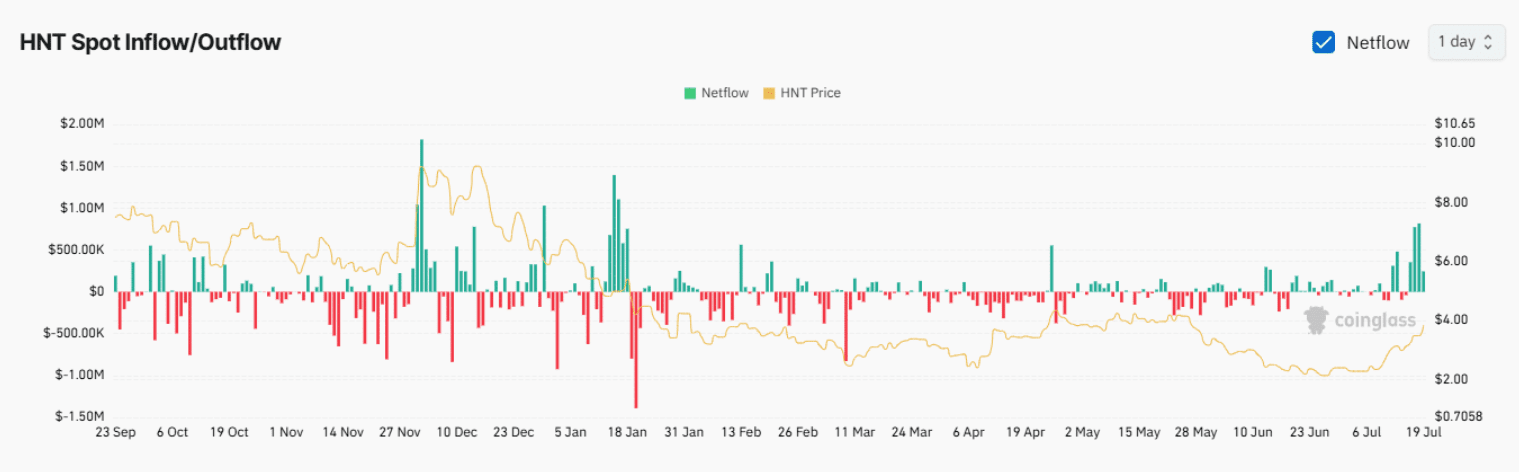
According to data from CoinGlass, over the past four days, traders in the spot market have sold approximately 2.17 million USD of HNT — a clear indication that profit-taking pressure is increasing. This selling trend is reflected in the large green bars over the past few days, showing that the outflow of funds is still occurring steadily. At the same time, the derivatives market is also recording similar signals.
Open interest (OI) has increased by 4%, reaching 7.34 million USD, indicating that speculative activity is on the rise. However, the balance between Long and Short orders leans towards the bears, implying that most of the 364,000 USD in additional liquidity over the past 24 hours comes from Short positions.
Notably, although the price of HNT continues to rise, trading volume has decreased by 10% — a warning sign that cannot be ignored. The price rising without corresponding trading volume often reflects a lack of sustainable upward momentum, thereby increasing the risk of short-term correction.
Technical indicators lean towards a correction trend.
The Money Flow Index (MFI), a tool for measuring the inflow and outflow of funds into and out of an asset, has exceeded the threshold of 80 — a zone considered overbought. This suggests that HNT may be overpriced and at risk of a short-term correction.
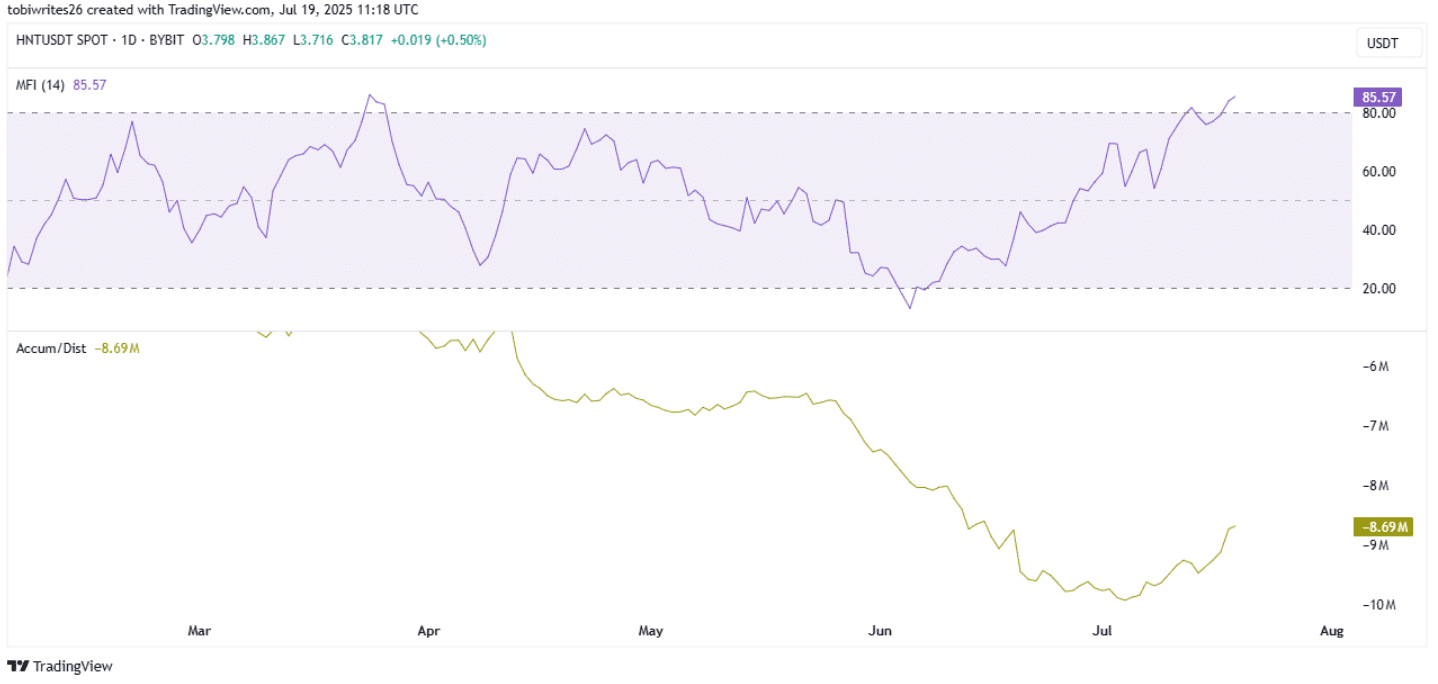
Notably, the Accumulation/Distribution (A/D) indicator remains in negative territory, indicating that selling pressure is dominating buying pressure. This is a clear sign that the market is entering a discount phase.
If this trend does not reverse soon, HNT may face a significant decline in the coming days.