

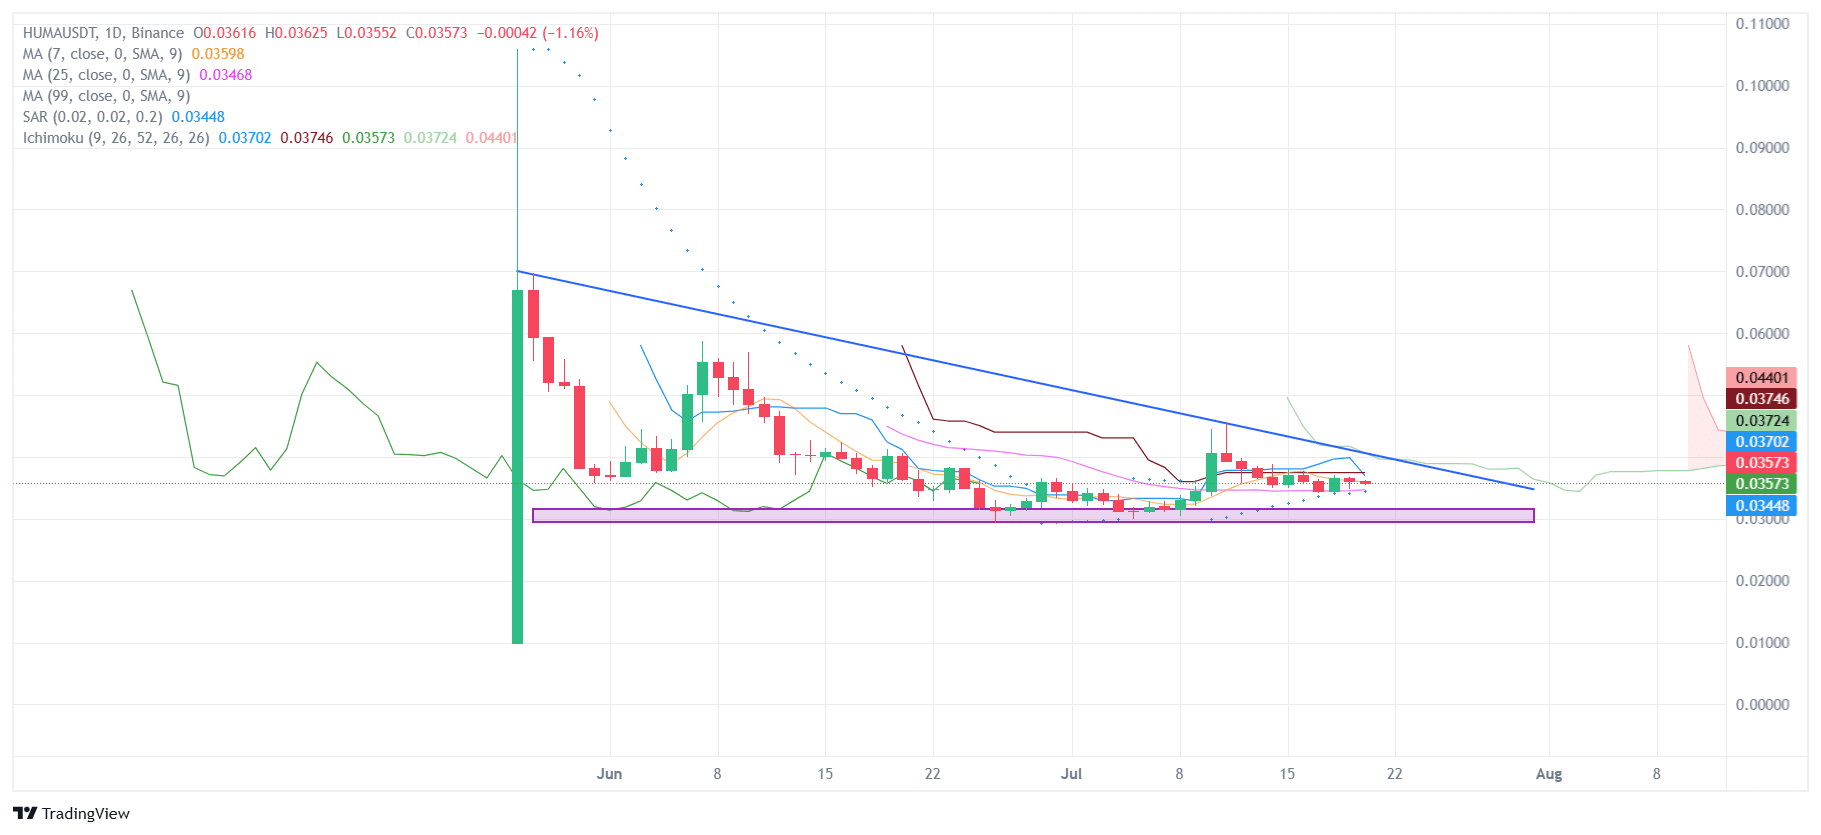
Analysis of HUMA/USDT, 1-day timeframe, a descending triangle is forming 📐.
Key points:
Resistance line: A clear descending trend line is visible, acting as resistance, limiting price growth.
Support level: A strong horizontal support level is observed around $0.034-$0.035, from which the price has bounced several times. This is an important area for bulls.
Volume: The chart shows that there was high volume during the strong rise at the end of May 📈. Subsequently, the volume decreased, which is characteristic of consolidation.
Indicators:
Moving Averages (MA): The price is below short-term moving averages (7, 25, 99 MA), indicating a bearish sentiment in the short term 🐻.
SAR (Stop and Reverse): The SAR points are above the price, confirming the downward trend.
Ichimoku: The price is below the Ichimoku cloud, which also indicates a bearish sentiment.
Current situation: The price is currently trading in a narrow range between descending resistance and horizontal support, approaching the top of the triangle.
Conclusions and forecast:
The descending triangle is a bearish continuation or reversal pattern. A breakdown below the support level ($0.034-$0.035) may lead to a significant price drop 📉. At the same time, a breakout above the descending resistance line may signal a bullish reversal and potential growth 🚀.
What to expect next:
In the near future, a resolution of the situation is expected: either a breakdown of the support level or a breakout of the descending trend line. Pay close attention to the volume during the breakout! High volume during a downward breakout will confirm the bearish movement, while high volume during an upward breakout will confirm the bullish movement.
⚠️ Risks: Always remember the volatility of the crypto market! This is not financial advice. DYOR (Do Your Own Research) 🤓.
⚡️ PayFi — a new era of payments 🌍💳
The PayFi network accelerates international transfers and card payments, providing instant access to liquidity. No more delays—everything is fast, convenient, and secure! 🔄💰
