⚙️ General data from the chart:
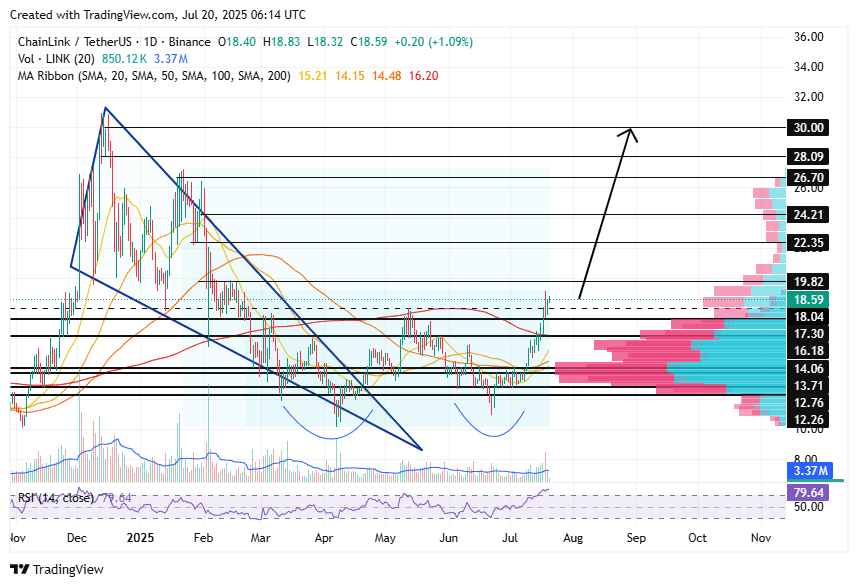
Current price: $18.59
Volume: ~3.37M (increasing volume confirms the breakout)
RSI (14): 79.64 — overbought
SMA 20/50/100/200:
SMA20/50/100/200: 15.21 / 14.15 / 14.48 / 16.20
📐 Chart analysis:
✅ Bullish signals:
Exit from a falling wedge:
This is a classic bullish reversal pattern.
The upward breakout has already occurred on strong volume.
Double bottom:
Confirmed by the neckline breakout in the ~$17.30–18.00 area.
Double bottom target — height of the formation added to the breakout:
→ ~14.00 + (18.00 – 13.00) = $19.00–20.00 — first short-term target reached or nearly reached.
📊 Resistance levels (targets):
Level Value
Nearest resistance $19.82
Next $22.35
Further $24.21
Main medium-term $26.70
Key level $30.00
🛡️ Support levels:
Level Value
Strongest demand zone $14.00 – $16.00 (volume cluster)
Next support $13.71
Key $12.76 / $12.26
📈 LONG scenario:
Probability: 🔼 High (over 70%)
Entry point:
Aggressive: current ($18.50–$18.60)
Conservative: retest of the $17.30–$18.00 zone
TP1: $19.80
TP2: $22.30
TP3: $24.20
TP4: $26.70
SL: below $17.30 (key breakout level), for example: $16.90
📉 SHORT scenario:
Probability: 🔽 Low (less than 25%, possible on false breakout and RSI reversal)
Entry: on a false breakout above $19.82 and a return below $18.00
TP: $16.20 / $14.00
SL: $20.00
💡 Consolidation scenario:
If RSI stays above 75 and volume decreases, sideways consolidation is possible in the range:
→ $17.30–$19.80
📌 Indicators:
RSI: 79.64 — overbought zone, a pullback is possible but not mandatory with strong momentum.
SMA band: price above all moving averages — clear bullish trend.
Volumes: increasing volume confirms the validity of the breakout.
📋 Conclusion:
The current technical structure #LINK indicates a confirmed bullish reversal. The double bottom breakout and falling wedge on increasing volume creates a strong foundation for growth. RSI in the overbought zone may lead to short-term consolidation or retest. However, the trend remains confidently upward.